Assignment 4
Goals
The goal of this assignment is to use pandas to work on data integration and data fusion.
Instructions
In this assignment, we will be working with data related to the COVID-19 pandemic. If you do not wish to work with such data (e.g. because of the impact the disease has had on your life), please contact me for an alternate assignment. Also, please note that the solutions from this assignment should not be used for any decisions related to COVID-19. While the datasets are real-world data, you should heed the advice of trained medical professionals and epidemiologists who understand the data and its complexities. Data is currently available from a number of sources, including the CDC, WHO, Wikipedia, and Our World in Data. The goal is to integrate data about different countries in order to understand the percent of each country’s population affected, and deal with information that comes from multiple sources, and try strategies to merge that data.
You may choose to work on the the assignment on a hosted environment (e.g. Azure Notebooks or Google Colab) or on your own local installation of Jupyter and Python. You should use Python 3.6 or higher for your work. To use cloud resources, you should be able to login with your NIU credentials to Azure Notebooks or create/login to a free Google account for Colab. If you choose to work locally, Anaconda is the easiest way to install and manage Python. If you work locally, you may launch Jupyter Lab either from the Navigator application or via the command-line as jupyter-lab.
Due Date
The assignment is due at 11:59pm on Tuesday, April 7. Please let me know if this deadline is not workable due to your circumstances.
Submission
You should submit the completed notebook file named a4.ipynb on Blackboard. Please use Markdown headings to clearly separate your work in the notebook.
Details
CS 490 students are responsible for Parts 1 and 3. CS 680 students are responsible for all parts.
1. Data Integration (Cases & Population) (30 pts)
We will start with some COVID-19 data from Microsoft. One factor in COVID-19 cases seems to be different effects based on age. Thus, we would like to integrate this data with information about each country’s population.
First, we will start with COVID-19 data gathered by Microsoft. Because this data is updated frequently, we will use data downloaded on March 22, 2020. It is available here:
Second, we will use population data from World Bank Open Data. We will use information about the number of people aged 0-14, 15-64, and 65+. Again, I have downloaded this data and transformed it:
You can load this data (and the rest of the data files for the assignment) with the following code:
import os
from urllib.request import urlretrieve
import pandas as pd

urls = ['http://faculty.cs.niu.edu/~dakoop/cs680-2020sp/a4/bing-covid-2020-03-22.csv',
        'http://faculty.cs.niu.edu/~dakoop/cs680-2020sp/a4/world-bank-population-2018.csv',
        'http://databank.worldbank.org/data/download/catalog/cckp_historical_data_0.xls',
        'http://faculty.cs.niu.edu/~dakoop/cs680-2020sp/a4/owid-2020-03-22.csv',
        'http://faculty.cs.niu.edu/~dakoop/cs680-2020sp/a4/jhu-2020-03-22.csv',
        'http://faculty.cs.niu.edu/~dakoop/cs680-2020sp/a4/wiki-2020-03-22.csv',
        'http://faculty.cs.niu.edu/~dakoop/cs680-2020sp/a4/country-codes.csv']
for url in urls:
    local_fname = url[url.rfind('/')+1:]
    if not os.path.exists(local_fname):
        urlretrieve(url, local_fname)
covid_df = pd.read_csv('bing-covid-2020-03-22.csv')
pop_df = pd.read_csv('world-bank-population-2018.csv')
a. Merging (10 pts)
Your job is to integrate these data sets so that we have data with both COVID-19 cases and population. Use a merge that ensures that every row of the COVID-19 dataset remains, regardless of whether we have data about its population. Note that the COVID-19 dataset also has names for “areas” that are not necessarily countries (e.g. the ‘Diamond Princess’, a cruise ship which had a number of cases). You may use displayName from the COVID-19 dataset here to match (country also works to match “Czech Republic” but then fails on “China”). Name the merged data frame merged.
Hints
- To merge and keep rows from one dataset, consider which method (the
howparameter) should be used: “inner”, “left”, “right”, or “outer”.
b. Cleanup (10 pts)
[Updated: 3/29: 25 instead of 17.] You should find 25 “areas” that do not have matched population data. You can find these by checking for null entries in the population part of the merged data. If merged is the data frame, merged[merged['Country Code'].isnull()] will show these rows. Some of these are due to different names, and others do not exist in the dataset (due to the nature of the area or decisions by the World Bank). Let’s try to fix those countries that have data. Use any means to find the country codes the World Bank uses for the countries. You can also find these codes here on Wikipedia.
Copy the code below into your notebook and update the translate dictionary with by replacing the appropriate country codes with the three-letter codes. Note that there are seven “areas” including the first three for which you will not find matching rows in the population data, and those may remain None. Then, run the code. (Make sure your merged dataset is named merged or modified the code accordingly.)
translate = {'Jersey': None,
             'Guernsey': None,
             'Kyrgyzstan': None,
             'China (mainland)': 'CHN',
             'Saint Vincent and the Grenadines': 'VCT',
             'Saint Lucia': 'LCA',
             'Congo': 'COG',
             'Cape Verde': 'CPV',
             'Bahamas': 'BHS',
             'Côte d’Ivoire': 'CIV',
             'Iran': 'IRN',
             'South Korea': None,
             'Diamond Princess': None,
             'Czechia': None,
             'Hong Kong SAR': None,
             'Egypt': None,
             'Russia': None,
             'Taiwan': None,
             'Slovakia': None,
             'Brunei': None,
             'Palestinian Authority': None,
             'Venezuela': None,
             'Macao SAR': None,
             'Ivory Coast': None,
             'Congo (DRC)': None,
             'Congo': None,
             'Vatican City': None}

covid_df['countryCode'] = merged['Country Code']
covid_df.loc[:,'countryCode'].update(covid_df['displayName'].map(translate))
Finally, merge the covid_df and pop_df again but using the countryCode and Country Code columns this time. Again, we want to preserve all rows from the COVID-19 data frame regardless of whether they have matching population data. If you call your final merged data frame merged, you can find the 25 countries that were missing data via:
fields = ['displayName',
          'Population ages 0-14, total',
          'Population ages 15-64, total',
          'Population ages 65 and above, total',
          'Population, total']
merged[merged['displayName'].isin(translate.keys())][fields]
Your numbers for the 25 areas that were missing population data should look like:
| displayName | Population ages 0-14, total | Population ages 15-64, total | Population ages 65 and above, total | Population, total | |
|---|---|---|---|---|---|
| 0 | China (mainland) | 248978380.0 | 991653198.0 | 152098421.0 | 1.392730e+09 |
| 5 | Iran | 20021891.0 | 56719380.0 | 5058998.0 | 8.180027e+07 |
| 7 | South Korea | 6698809.0 | 37491389.0 | 7445058.0 | 5.163526e+07 |
| 22 | Czechia | 1656185.0 | 6905907.0 | 2063603.0 | 1.062570e+07 |
| 27 | Diamond Princess | NaN | NaN | NaN | NaN |
| 46 | Russia | 25881914.0 | 97394403.0 | 21201732.0 | 1.444780e+08 |
| 48 | Egypt | 33265916.0 | 60010342.0 | 5147337.0 | 9.842360e+07 |
| 49 | Hong Kong SAR | 886736.0 | 5306904.0 | 1257360.0 | 7.451000e+06 |
| 57 | Slovakia | 841353.0 | 3754331.0 | 851327.0 | 5.447011e+06 |
| 64 | Taiwan | NaN | NaN | NaN | NaN |
| 78 | Brunei | 98775.0 | 309283.0 | 20904.0 | 4.289620e+05 |
| 85 | Venezuela | 7987416.0 | 18784786.0 | 2097993.0 | 2.887020e+07 |
| 95 | Palestinian Authority | NaN | NaN | NaN | NaN |
| 104 | Congo (DRC) | 38810574.0 | 42720476.0 | 2537041.0 | 8.406809e+07 |
| 113 | Guernsey | NaN | NaN | NaN | NaN |
| 114 | Macao SAR | 86244.0 | 479170.0 | 66222.0 | 6.316360e+05 |
| 117 | Jersey | NaN | NaN | NaN | NaN |
| 118 | Côte d’Ivoire | 10513276.0 | 13839238.0 | 716715.0 | 2.506923e+07 |
| 119 | Kyrgyzstan | NaN | NaN | NaN | NaN |
| 132 | Bahamas | 86711.0 | 270941.0 | 27988.0 | 3.856400e+05 |
| 136 | Cape Verde | 156484.0 | 362219.0 | 25064.0 | 5.437670e+05 |
| 138 | Congo | 2190230.0 | 2913494.0 | 140639.0 | 5.244363e+06 |
| 152 | Saint Lucia | 33702.0 | 130350.0 | 17837.0 | 1.818890e+05 |
| 164 | Saint Vincent and the Grenadines | 24843.0 | 74798.0 | 10569.0 | 1.102100e+05 |
| 167 | Vatican City | NaN | NaN | NaN | NaN |
Hints
- Wikipedia’s search box can sometimes be useful in resolving country names
c. Analysis (10 pts)
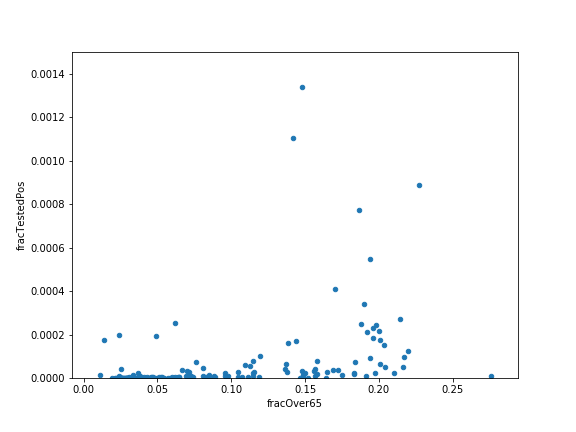
Now, compute the fraction of the population that has tested positive for COVID-19. Note that this does not necessarily indicate the total fraction of people who have or have had COVID-19 because some countries test different numbers of people via different criteria. Sort these values in a descending order, ignoring NaN or inf values. Show the five countries that have the highest fractions of their populations that have confirmed cases.
Finally, plot the fraction of people over 65 versus the fraction testing positive. First compute the fraction of people over 65. Then, use pandas’ plot.scatter method to do this. Try setting the optional argument ylim to (0,0.0015) to better see the data.
Hints:
- You can replace
np.infvalues withnp.nanvalues to simplify the sort sort_valueswill be useful, and look at the parameters to find one that will sort in descending order.- Make sure you have
matplotlibinstalled to generate the plots. Useconda install matplotlibif it isn’t already installed. - The Pandas
str.containsmethod can be useful for searching the population data for parts of a country name to locate their country codes. plot.scatterrequires you to identify the columns to plot for x and y.
2. [CS680 Required] Data Integration (Cases & Temperature) (35 pts)
There is a hypothesis is that weather may play a role in the community spread of COVID-19 as with the flu and other viruses, but given cases in tropical climates or countries where it is summer right now (e.g. Australia), it is unclear for COVID-19. For this part of the assignment, we will integrate temperature data. This data comes from the World Bank’s Climate Change Knowledge Portal and is available via this link. Note, however, that if you ran the download code from Part 1, you should have a local copy of the data named cckp_historical_data_0.xls.
a. Merging (10 pts)
Load the Excel data (cckp_historical_data_0.xls). Note that this is an Excel file, and will require the xlrd python module to work. You can install it via conda. Remember, you must pass an argument to read_excel indicating which sheet you wish to load. We want the temperature data by country. Now, using the same merged data frame from Part 1, merge in the new temperature data. Merge the temperature data with the merged data from part 1. The temperature data includes the country code making it easier to merge with our data. You must determine which column this is and merge appropriately.
Hints
- Open the spreadsheet in Excel/Numbers/OpenOffice to check which sheet to load.
b. Imputation (15 pts)
Despite an easier merge, we still have 24 rows without temperature data. We cannot fix this in a similar manner as Part a because the dataset doesn’t have the data. However, we can use the temperatures of countries that are close to the specified country instead. To do this, we need to calculate the closest countries. The COVID-19 dataset gives us locations in the form of latitude (lat) and longitude (long). We can use Haversine Distance to calculate distances. However, we don’t want to substitute temperatures when the nearest country is over 500 kilometers away (perhaps this threshold should be closer). Using scikit-learn (conda install scikit-learn if it isn’t already installed), we can do this efficiently. The below code assumes your data frame (with merged temperatures) is called merged_temp. Then, it computes the closest country (by distance) unless it is further than 500km away, in which case this is -1.
from sklearn.neighbors import DistanceMetric
rlatlon = np.radians(merged_temp[['lat', 'long']].values)
haversine = DistanceMetric.get_metric('haversine')
dist = 6371 * haversine.pairwise(rlatlon) # dist in km
np.fill_diagonal(dist, 1e9) # make sure we don't select point itself
min_dist = dist.argmin(axis=0) # find index of minimum along rows
min_dist_vals = dist.min(axis=0) # find minimum value along rows
closest_idxs = np.where(min_dist_vals < 500, min_dist, -1)
Now use closest_idxs to update the March temperature (Mar_temp) for those countries for which we have a close match. Note that because we are using raw numpy, the indices are numeric and may not match the index of your merged data frame. You should either call reset_index to return the labels to numeric identifiers that will match up closest_idxs or carefully use iloc calls. Also, make sure you only change the countries that are missing temperature data. Some countries will still lack temperature data because we don’t have another country close enough with data. After adding the March temperature data, the 24 missing countries should now show the following:
| displayName | Mar_temp | |
|---|---|---|
| 27 | Diamond Princess | 2.523118 |
| 37 | Singapore | NaN |
| 44 | Bahrain | 21.784334 |
| 49 | Hong Kong SAR | NaN |
| 62 | San Marino | 6.522076 |
| 64 | Taiwan | NaN |
| 75 | Andorra | 6.369563 |
| 83 | Malta | 14.206689 |
| 95 | Palestinian Authority | 14.958143 |
| 99 | Liechtenstein | 0.090183 |
| 108 | Kosovo | 4.766064 |
| 113 | Guernsey | NaN |
| 114 | Macao SAR | NaN |
| 117 | Jersey | NaN |
| 119 | Kyrgyzstan | NaN |
| 122 | Maldives | NaN |
| 123 | Monaco | 0.090183 |
| 128 | Seychelles | NaN |
| 131 | Barbados | NaN |
| 136 | Cape Verde | NaN |
| 149 | Isle of Man | 4.655665 |
| 152 | Saint Lucia | 25.896999 |
| 155 | Antigua and Barbuda | NaN |
| 167 | Vatican City | 6.522076 |
Hints
- Note that the column labels change use both
tempandTemp. - You can check missing data by looking for rows for which
isnullis true.
c. Analysis (10 pts)
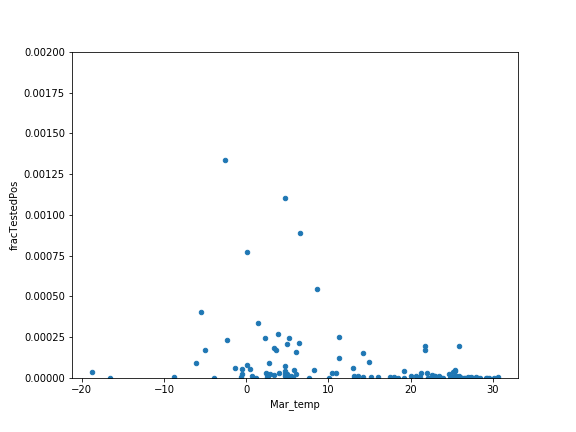
Plot the March temperature versus the fraction tested positive, again using the plot.scatter method.
3. Data Fusion (55 pts)
Because data about COVID-19 comes from all across the world, there are different entities collecting and publishing the data. In addition, this data is collated by different organizations in different ways. To that end, we are interested in trying to understand the values that the various sources are capturing and potentially detect when sources depend on each other. For this part of the assignment, we will use multiple sources with different fields:
- Our World in Data (OWID)
date: the date the data was publishedlocation: the country/regionnew_cases: the number of new cases reported since the previous daynew_deaths: the number of new deaths reported since the previous daytotal_cases: the cumulative number of cases to datetotal_deaths: the cumulative number of deaths to date
- Johns Hopkins CSSE (JHU)
Date: the date the data was publishedCountry/Region: the country/regionProvince/State: the province/stateConfirmed: the number of confirmed case to dateDeaths: the number of deaths to dateRecovered: the number of recoveries to date
- Wikipedia (Wiki)
date: the date the data was publishedcountry: the country/regioncases: the number of confirmed cases to datedeaths: the number of deaths to daterecoveries: the number of recoveries to date
The raw data (especially from Wikipedia) is separated into different files for some datasets so I have cleaned it up a bit. You can download these datasets here:
- http://faculty.cs.niu.edu/~dakoop/cs680-2020sp/a4/owid-2020-03-22.csv
- http://faculty.cs.niu.edu/~dakoop/cs680-2020sp/a4/jhu-2020-03-22.csv
- http://faculty.cs.niu.edu/~dakoop/cs680-2020sp/a4/wiki-2020-03-22.csv
You can adapt the code from Part 1 to download these files directly to your notebook (important for those working on the cloud).
Some of this data takes some massaging to get into a form where we can examine the reports from each day. Then, we must again match countries and align the different fields.
a. Matching (10 pts)
First, let’s load each data source (OWID, JHU, Wiki). Now, we need to attempt to line up different countries. This can be a complex procedure because we need to resolve names that can be different. For example, “DR Congo”, “Congo (Kinshasa)”, and “Democratic Republic of Congo” are all the same country described differently. Wikipedia’s redirection capabilities help here as typing any of the three strings into the search box will direct you to the same page. We can extract the ISO 3661-2 code for each country or region to better compare the datasets. Note that this two-character code is different from the three-character code that the World Bank uses. Download and use the file country-codes.csv to add a new column to each dataset that indicates its country code. Some country names may not translate. That is ok.
Hints:
- To load the country codes data, and convert it to a dictionary, try using the
to_dictmethod after converting the data frame to a Series and setting the index to the country name. - The
mapmethod will be useful to translate from country name to country code.
b. Grouping (10 pts)
In the JHU data, you will notice that the data is broken down into provinces and states for some countries. We will be comparing across countries so we need to sum all of the Confirmed, Deaths, and Recovered numbers for each Country/Region and Date. Use pandas’ groupby method to sum these three fields by country and date.
Hints
- Make sure to groupby two fields, country code and date.
- After the groupby, the country code and date columns will be in the index. You can call
reset_indexto move theCountry/RegionandDatecolumns from the index back to “normal” columns, but you don’t need to. Just realize that the merge in Part c may be different depending on your choice.
c. Merging (10 pts)
Using the country codes we added to each dataset in Part a, we want to merge the three datasets together. We need to do this both by country code and date because we don’t want to merge the data from different dates. Merging three datasets will require two merge calls. Finally, set the index to be a MultiIndex that includes both the country code and date.
Hints
- Make sure to merge the Johns Hopkins data that was grouped and summed, not the original data frame.
- If the merge isn’t working, check whether the columns are actually in the index.
d. Fusion (15 pts)
Determine which fields of each dataset link together. For example, the total_cases field in the Our World in Data dataset matches the Confirmed field in the Johns Hopkins data and the cases field in the Wikipedia data.
To fuse the values without any knowledge about the underlying sources of the data, we can try to use an average or take the maximum or minimum. We will do this first for the number of cases. Select only the three columns related to each dataset’s total number of cases. Then, run the agg method on the rows with the aggregation functions “min”, “max”, and “mean”. You should obtain a result like:
| min | max | mean | ||
|---|---|---|---|---|
| CN | 2020-01-29 | 5494.0 | 5994.0 | 5813.0 |
| TH | 2020-01-29 | 14.0 | 14.0 | 14.0 |
| TW | 2020-01-29 | 8.0 | 8.0 | 8.0 |
| JP | 2020-01-29 | 7.0 | 7.0 | 7.0 |
| MY | 2020-01-29 | 4.0 | 7.0 | 6.0 |
| … | … | … | … | … |
| PG | 2020-03-22 | 1.0 | 1.0 | 1.0 |
| SO | 2020-03-22 | 1.0 | 1.0 | 1.0 |
| TL | 2020-03-22 | 1.0 | 1.0 | 1.0 |
| UG | 2020-03-22 | 1.0 | 1.0 | 1.0 |
| VA | 2020-03-22 | 1.0 | 1.0 | 1.0 |
Calculate the same results for deaths and recoveries, but note that the Our World in Data dataset does not have recoveries so there will only be two columns.
Hints
- Check the
axisparameter for theaggmethod.
e. Analysis (10 pts)
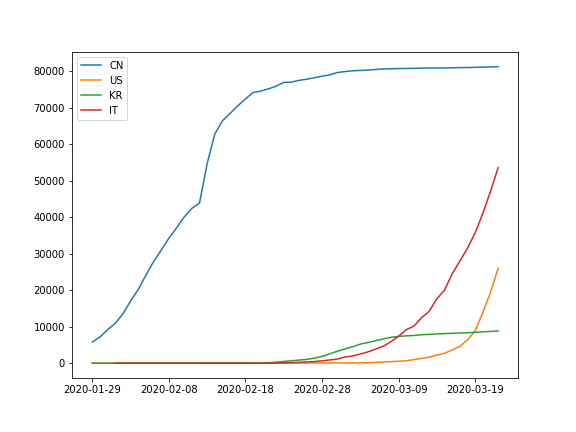
First, find the date and country for which the difference between the minimum number of cases and the maximum number of cases is largest.
Second, plot a line graph of the mean number of cases for China (CN), South Korea (KR), the United States (US), and Italy (IL), based on the three datasets.
Hints
Extra Credit
- CS 490 students may do Part 2 for extra credit.
- Use the raw data from the World Bank, and transform it (using either Trifacta or pandas) into the CSV provided.
- Locate and download population data that is more fine-grained by age, and integrate that with the COVID-19 data. The World Bank has estimates for 0-4, 5-9, 10-14 age ranges, for example.
- Fuse the Microsoft Bing data with the three other datasets in Part 3.