Assignment 3
Goals
The goal of this assignment is to use Trifacta Wrangler and pandas to perform some data cleaning tasks.
Instructions
You will need to create a free account for Trifacta Wrangler and use the hosted environment there for the first part of the assignment. You may choose to work on the second part of the assignment on a hosted environment (e.g. Azure Notebooks or Google Colab) or on your own local installation of Jupyter and Python. You should use Python 3.6 or higher for your work. To use cloud resources, you should be able to login with your NIU credentials to Azure Notebooks or create/login to a free Google account for Colab. If you choose to work locally, Anaconda is the easiest way to install and manage Python. If you work locally, you may launch Jupyter Lab either from the Navigator application or via the command-line as jupyter-lab.
In this assignment, we will clean the raw HURDAT2 dataset for Atlantic hurricane data from 1851 through 2018. This dataset is provided by the National Hurricane Center and is documented here. Our goal is to get it into a format like the hurdat2.csv file used for Assignment 2.
Due Date
The assignment is due at 11:59pm on Tuesday, March 3.
Submission
You should submit both (a) the completed Trifacta recipe as an a3.wrangle file, and (b) the completed notebook file named a3.ipynb on Blackboard. Please use Markdown headings to clearly separate your work in the notebook.
Details
In both parts of the assignment, we will be transforming and cleaning the dataset from its raw form to the form used in Assignment 2. The set of changes include:
- Naming the columns appropriately
- Stripping whitespace
- Filling each tracking point with hurricane information (id, name, date, and time)
- Replacing missing value placeholders (UNNAMED, -99, and -999)
- Converting dates and times to a single timestamp
- [CS 680 Students] Standardizing latitude and longitude
CS 490 students are responsible for all tasks except the latitude and longitude standardization. CS 680 students are responsible for all tasks.
You may check your solutions against the reference solution. You can use a number of online (and offline) tools for comparing CSV files, or use the following pandas code:
df1 = pd.read_csv('hurdat2.csv', parse_dates=['datetime'])
df2 = pd.read_csv('hurdat2-solution.csv', parse_dates=['datetime'])
((df1 == df2) | (df1.isnull() & df2.isnull())).all(None)
If this returns True, everything matches. If it doesn’t you can investigate where the False values are in the data frame by looking at those rows which are False by changing the parameter for the all function to 1 (rows). You’ll want to index them as:
df1[~((df1 == df2) | (df1.isnull() & df2.isnull())).all(1)] # yours
df2[~((df1 == df2) | (df1.isnull() & df2.isnull())).all(1)] # solution
For CS 490 students, you will want to remove the latitude and longitude columns from comparison. Just add .drop(columns=['latitude','longitude'] after both read_csv methods above.
1. Trifacta Wrangler
Start by signing up for a free Wrangler account; click the “Start Wrangler” link here. Please note that Wrangler requires the Chrome browser. Documentation is available here. After your recipe is completed, show the Recipe, select the gears icon, and select “Download Recipe as wrangle”. Turn in that file as your solution for Part 1.
a. Load Data
Begin by downloading the raw dataset from NOAA to your computer. After signing in to Wrangler, click the “Import Data” button on the upper-right side of the home screen, and import the dataset you downloaded. You can choose the “Import and Wrangle” button to immediately start working. If you choose “Import” instead or come back to this later, you can go to the flows icon and create a new flow, selecting the dataset you have imported.
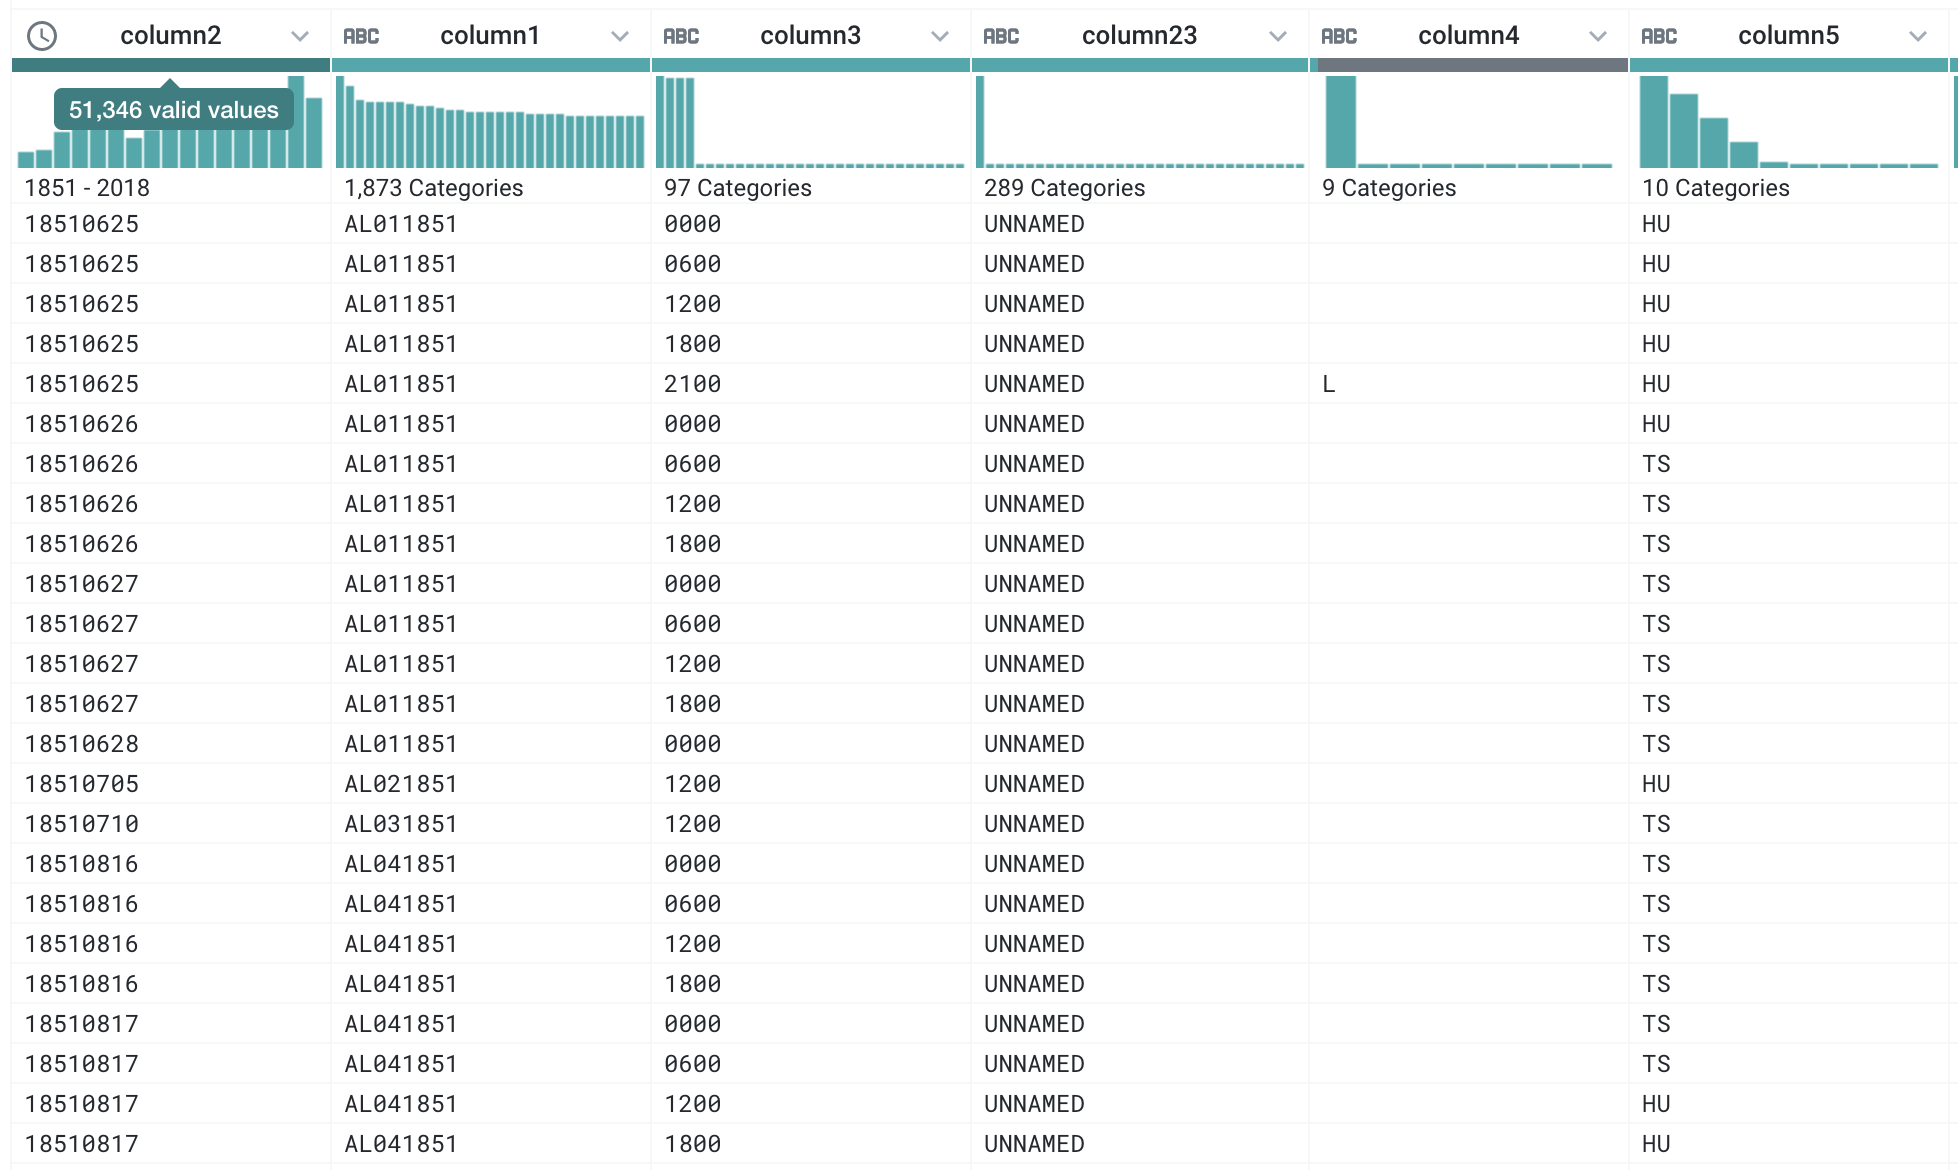
b. Cleanup & Remove Whitespace (5 pts)
First, get rid of the columns 10-22 that indicate the wind radii plus an extra one from the header format; we won’t be using them. Then, remove the whitespace at the beginning of each column. Use a replace task across all columns that uses Trifacta’s text matching language to replace one or more spaces at the start of the string with an empty string. Note that you must enclose patterns in backticks!
Hints
- Trifacta’s
{start}and character classes{[ ]}(a space) will be useful. - Note that you can select a range of columns to apply the replace step to, and it makes sense to try to apply this to all columns.
c. Extract and Fill Hurricane Information (15 pts)
Create new columns that extract patterns that match the hurricane identifying information. There are two columns that we are interested in; the hurricane identifier (e.g. AL011851) and the name (e.g. OSCAR). Then, fill in that information down for all empty cells to the next valid identifier or name. Finally, delete all of the original rows with hurricane information. There may be multiple ways of doing this, but here is one approach:
- Create extract rules that extract only cells from
column2andcolumn3, respectively, that match the type of information we want to create a new column. - Fill in the missing values with the last valid value.
- Delete those rows that match the pattern used to extract the information in step 1.
Now, you will be able to do a bit of cleanup by changing the first column’s type to an actual date/time column, changing column4 (with the L, I, entries) to a string column (click the ABC icon).
Hints
- Trifacta will suggest a meaningful extract pattern if you select the identifier rows.
- Remember that hurricanes are named in more modern times.
- The
{upper}class is useful for finding names. - The fill option is under the Replace -> Missing submenu for a column.
- Deleting rows should be a suggestion if you select the desired rows.
d. Replacing Missing Placeholders (10 pts)
Replace the UNNAMED values in the column that holds the hurricane names with an empty string (indicating a missing value). Once you make the change to the name column, you will see the number of categories change from 289 to 288. Also change -99 in column 8 (corresponding to maximum wind speed) and -999 in column 9 (corresponding to minimum pressure) to an empty string (also indicating a missing value).
Hints
- For column 8, you will probably need to write the rule without being able to select the desired value. You can do this from the column menu.
- You may need to change columns 9 back to an integer type after replacing the missing value.
e. Creating a Timestamp (10 pts)
Now create a new timestamp that includes both the date and time information in a single column. Because the time is formatted as HHMM with no delimiter, you will need to put the delimiter there to allow Trifacta to parse the date correctly. After converting this column to HH:MM, you can then merge the date column with the time column to create a new column for the timestamp.
Hints
- The Replace by Position transformation may help here. Note that you can set the start and end position to the same value.
- If you select two columns (hold the modify key to select multiple columns), you will see merge suggestions.
f. [CS 680 Only] Latitude and Longitude Cleanup (10 pts)
Update the columns that show latitude (values ending in N) and longitude (values ending in W or E) to convert them to the numeric values used by most mapping software. In that software, W is translated to a negative longitude value, and E is a positive value. For example, 70.3W becomes -70.3 and 12.2E becomes 12.2. N and S are similar for latitude, but the dataset contains no S values so all latitude values are positive, and this task should be easier than longitude. For longitude, there are many approaches, some using multiple auxiliary columns. However, you may also consider writing a formula (similar to Excel) to convert this column. See the documentation for information on how to write custom functions using the provided ones.
Hints
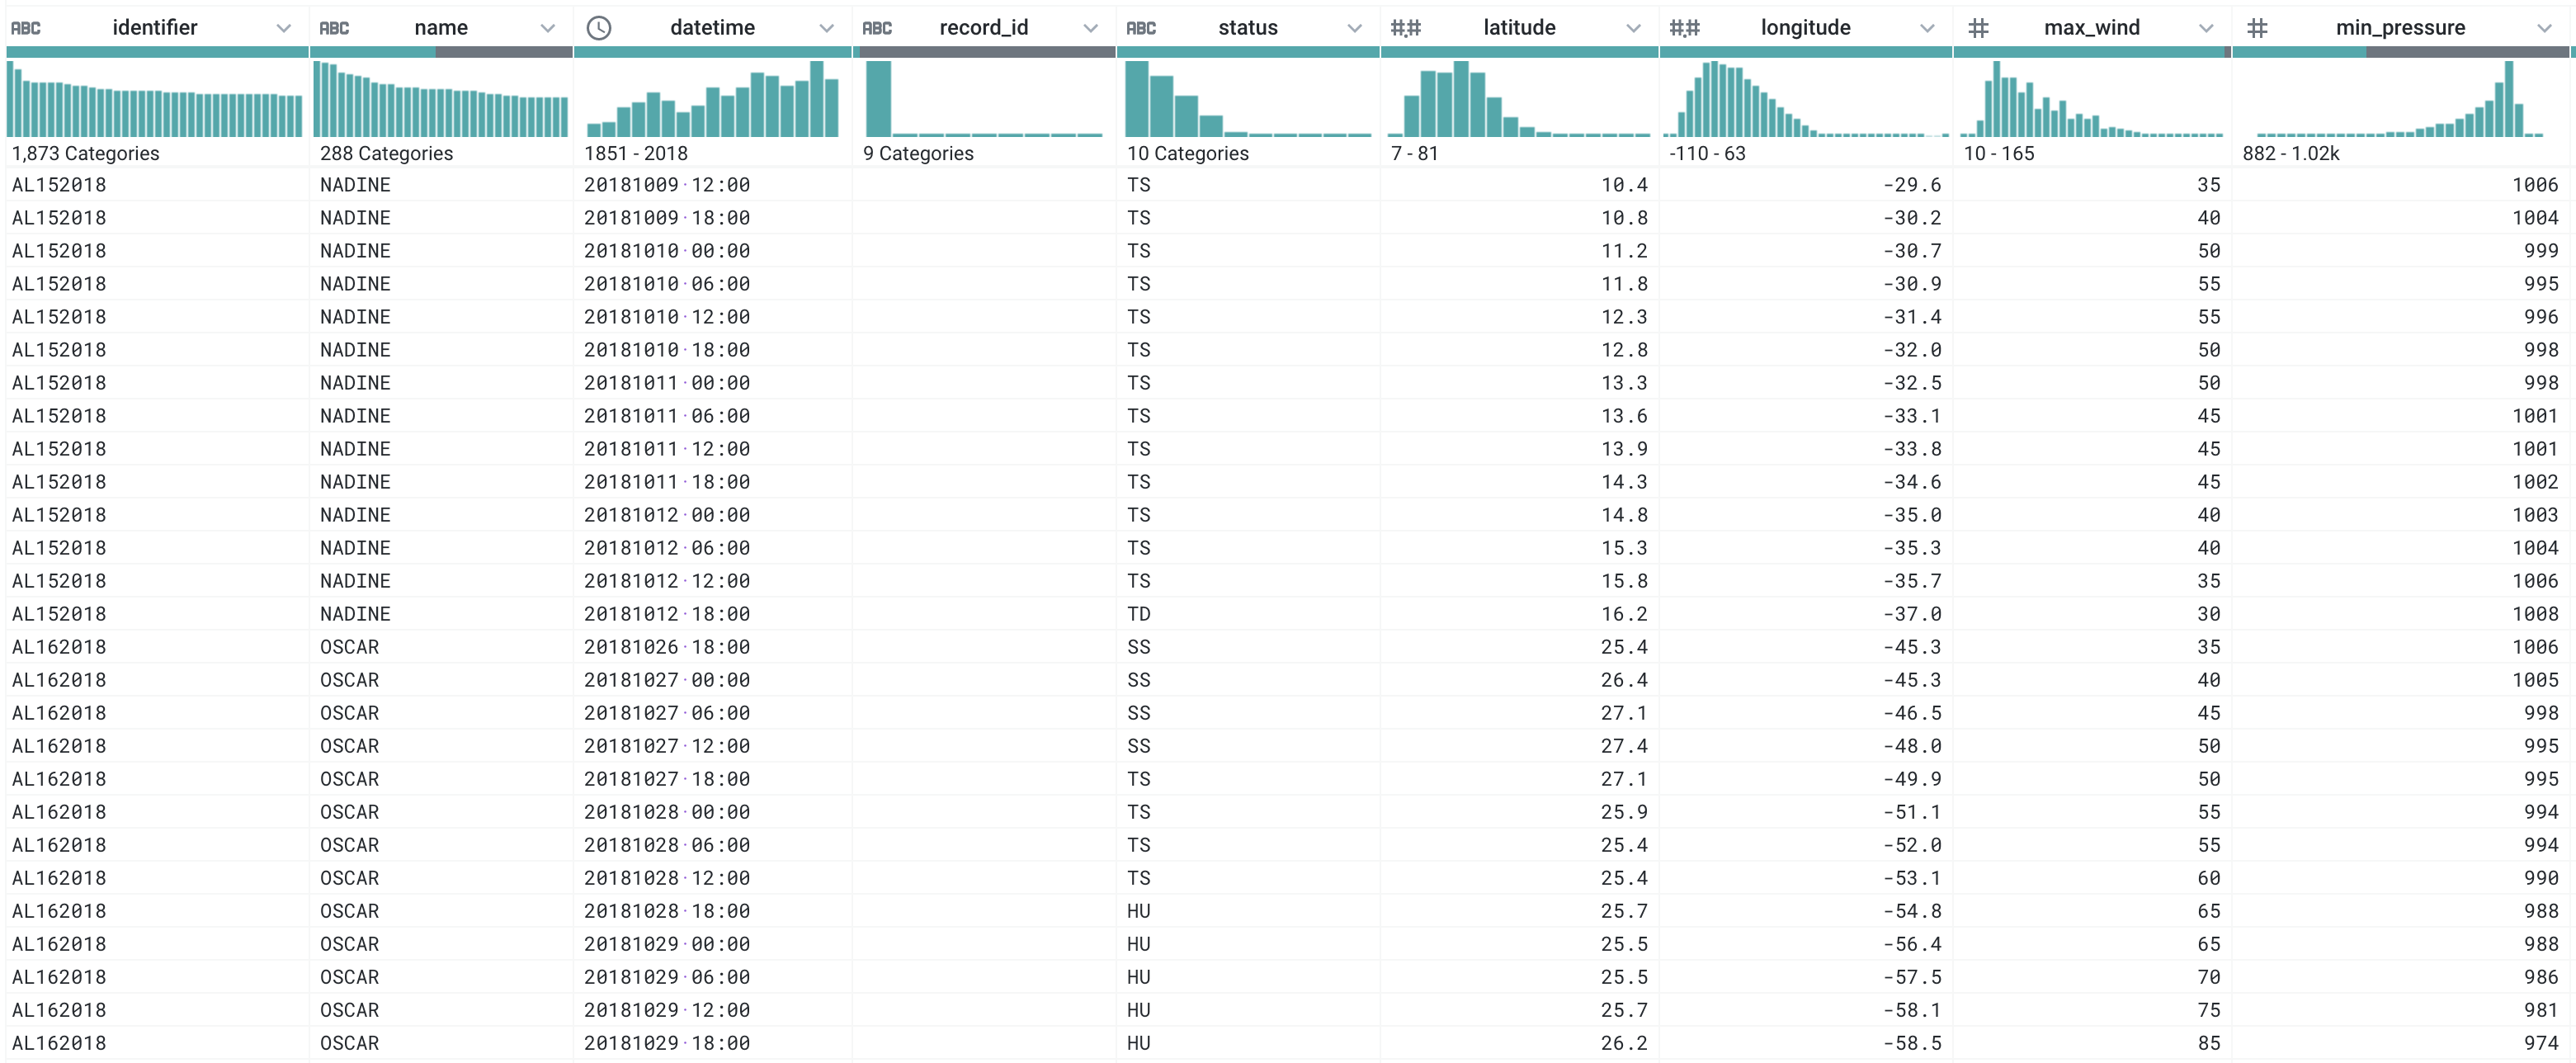
g. Name Columns (5 pts)
Name the columns appropriately and delete extra columns. You may also wish to move some of the columns around. You may consider doing this earlier, but because of new columns, you may find yourself renaming multiple times. Anyway, make sure you clean things up by the end. The columns should be named:
['identifier', 'name', 'datetime', 'record_id', 'name','status','latitude','longitude','max_wind','min_pressure']and be in this order. You can reorder the columns through the Move step if necessary. Make sure to turn in the recipe (.wrangle file) when you’re done. You can also check that your solution is correct by running the job and downloading the resulting CSV and comparing it against this file (see the Details section above for more information).
2. Pandas
For pandas, create a new Jupyter notebook and import the pandas library. After completing this part, turn in your .ipynb notebook as your solution to this part of the assignment.
a. Reading Data and Naming Columns (10 pts)
Read the data from hurdat2.txt using panda’s read_csv method and name the columns accordingly. If you do this assignment in the same directory as you did in Part 1, you should still have the hurdat2.txt file locally. Alternatively, you can run the following code to download it:
import os
from urllib.request import urlretrieve
url = "https://www.nhc.noaa.gov/data/hurdat/hurdat2-1851-2018-120319.txt"
local_fname = "hurdat2.txt"
if not os.path.exists("hurdat2.txt"):
    urlretrieve(url, local_fname)
If you try to read the data using just the filename, you will get a strange result where each row has a really long label. Remember that the format looks like:
AL011851,            UNNAMED,     14,
18510625, 0000,  , HU, 28.0N,  94.8W,  80, -999, -999, -999, -999, -999, -999, -999, -999, -999, -999, -999, -999, -999,
18510625, 0600,  , HU, 28.0N,  95.4W,  80, -999, -999, -999, -999, -999, -999, -999, -999, -999, -999, -999, -999, -999,
alternating between hurricane identification information and specific tracking points. So (a) there is no header specifying what the columns store, and (b) there are different numbers of fields in each row depending on whether the row is hurricane identifier information or tracking points. Read in eight columns (you may ignore the rest of the columns again) and name them as follows:
By default, pandas will parse rows like " UNNAMED, HU" and keep the leading whitespace so you get values like " UNNAMED" and " HU". We do not want this extra whitespace. Luckily, there is a read_csv option to remove it (find it in the docs). The output should look like:
| date | time | record_id | status | latitude | longitude | max_wind | min_pressure | |
|---|---|---|---|---|---|---|---|---|
| 0 | AL011851 | UNNAMED | 14 | NaN | NaN | NaN | NaN | NaN |
| 1 | 18510625 | 0000 | NaN | HU | 28.0N | 94.8W | 80.0 | -999.0 |
| 2 | 18510625 | 0600 | NaN | HU | 28.0N | 95.4W | 80.0 | -999.0 |
| … | … | … | … | … | … | … | … | … |
| 53216 | 20181104 | 0000 | NaN | EX | 59.8N | 14.5W | 45.0 | 968.0 |
| 53217 | 20181104 | 0600 | NaN | EX | 60.8N | 12.1W | 40.0 | 973.0 |
| 53218 | 20181104 | 1200 | NaN | EX | 62.4N | 9.1W | 40.0 | 977.0 |
Hints:
- Check that the DataFrame looks correct by displaying it. If the variable
dfreferences the DataFrame, just typingdfin a cell will display the table. - Remember to tell pandas not to read in a header for this CSV file (see the
read_csvdocs) - If you don’t provides the list of column names (see the
read_csvdocs),read_csvmay complain about having too many columns. If you specify that the data has the eight columns listed above, it will fill in empty columns withNaNvalues.
b. Extract and Fill Identifiers (15 pts)
Clearly, we still have an issue in that the rows that are hurricane identifiers are mixed in with rows that have tracking information. We want this information to be attached to each tracking point row. This involves four steps:
- Extract out those rows with the identifier and name, and put them in new columns named named
identifierandname. - Fill in this information for the tracking points
- Delete the rows that just contain identifier information
- Move the new columns to the front of the data frame.
The final data should look like:
| identifier | name | date | time | record_id | status | latitude | longitude | max_wind | min_pressure | |
|---|---|---|---|---|---|---|---|---|---|---|
| 1 | AL011851 | UNNAMED | 18510625 | 0000 | NaN | HU | 28.0N | 94.8W | 80.0 | -999.0 |
| 2 | AL011851 | UNNAMED | 18510625 | 0600 | NaN | HU | 28.0N | 95.4W | 80.0 | -999.0 |
| 3 | AL011851 | UNNAMED | 18510625 | 1200 | NaN | HU | 28.0N | 96.0W | 80.0 | -999.0 |
| … | … | … | … | … | … | … | … | … | … | … |
| 53216 | AL162018 | OSCAR | 20181104 | 0000 | NaN | EX | 59.8N | 14.5W | 45.0 | 968.0 |
| 53217 | AL162018 | OSCAR | 20181104 | 0600 | NaN | EX | 60.8N | 12.1W | 40.0 | 973.0 |
| 53218 | AL162018 | OSCAR | 20181104 | 1200 | NaN | EX | 62.4N | 9.1W | 40.0 | 977.0 |
Hints:
- To select identifier rows, look at the first few characters of the
datefield, and use a boolean expression on the string representation (.str) of that field. - Remember that new columns can be copied/created using bracket assignment (
df['newcol_name'] = ...). Multiple columns can be assigned using a list of columns on the left-hand side. - Use
fillnaon only the new columns that need to be filled and use the proper fill method (see thefillnadocs) - To select those rows that are not identifier rows, you can negate (
~) the boolean expression used to select them. - To reorder columns, you can just pass the new order to the dataframe (
df[['c4','c5','c1','c2','c3']]). Use slicing ondf.columnsto do this without rewriting all the column names.
c. Replace Missing Value Placeholders (10 pts)
We wish to replace hurricane names of UNNAMED, the max_wind values of -99, and the minimum pressure values of -999 with NaN (np.nan).
Hints:
- The
replacemethod will work over the entire data frame or over a particular column. - Pandas reads in the -99 and -999 values as floats so you may need to construct the value to be replaced as a float.
- Remember to either update the DataFrame in place or update the reference to the updated DataFrame.
d. Create a timestamp (10 pts)
Right now, we have two columns for date and time. This makes it difficult to calculate the amount of time between two different hurricane tracking points. If we convert them to a timestamp, such calculations are easy. To do this, we can use pandas’ to_datetime method. This method can convert from strings to timestamps. In our case, if we concatenate the date and time columns, and feed the concatenated series to to_datetime, things should work. Add the new column named as datetime and remove the old date and time columns. Move this column to appear after the name column.
Hints:
- To concatenate strings, you can have pandas treat the column as a string using
.str[:]. Then you can use standard string operators like+for concatenation. - To reorder columns, you can just pass the new order to the dataframe (
df[['c4','c5','c1','c2','c3']]). Use slicing ondf.columnsto do this without rewriting all the column names.
e. [CS 680 Only] Convert Latitude and Longitude (10 pts)
In the original data, latitudes are specified like 28.0N or 34.5S while longitudes are 94.8W or 4.5E. Most systems store such values as negative or positive numbers where S latitudes and W longitudes are stored with a negative sign. We will use pandas methods to convert these values to that format. In this case, we want to end up with a float type for these columns at the end. There are different ways to do the conversion, but one method is to use string indexing (.str[<index-or-slice>]) to extract out the last character (N,E,S,W), convert that to a boolean (use a comparison), and then convert the boolean to a number via .astype(int). True values become 1 and false values become 0, but we will need 1 and -1. Multiply the rest of the value (converted to a float) by the indicator (-1 or 1) to obtain the desired result.
Hints:
- You can use
astypeto convert a string column to floats - If you have a value in [0,1] and want to scale it to [-1,1], multiply by 2 and then subtract 1.
- Remember to put the computed columns back into the data frame, replacing the original columns.
After all of these changes, your data frame should look something like:
| identifier | name | datetime | record_id | status | latitude | longitude | max_wind | min_pressure | |
|---|---|---|---|---|---|---|---|---|---|
| 1 | AL011851 | 1851-06-25 00:00:00 | NaN | HU | 28.0 | -94.8 | 80.0 | NaN | |
| 2 | AL011851 | 1851-06-25 06:00:00 | NaN | HU | 28.0 | -95.4 | 80.0 | NaN | |
| 3 | AL011851 | 1851-06-25 12:00:00 | NaN | HU | 28.0 | -96.0 | 80.0 | NaN | |
| 4 | AL011851 | 1851-06-25 18:00:00 | NaN | HU | 28.1 | -96.5 | 80.0 | NaN | |
| 5 | AL011851 | 1851-06-25 21:00:00 | L | HU | 28.2 | -96.8 | 80.0 | NaN | |
| … | … | … | … | … | … | … | … | … | … |
| 53214 | AL162018 | OSCAR | 2018-11-03 12:00:00 | NaN | EX | 57.9 | -19.6 | 55.0 | 960.0 |
| 53215 | AL162018 | OSCAR | 2018-11-03 18:00:00 | NaN | EX | 58.9 | -17.1 | 50.0 | 964.0 |
| 53216 | AL162018 | OSCAR | 2018-11-04 00:00:00 | NaN | EX | 59.8 | -14.5 | 45.0 | 968.0 |
| 53217 | AL162018 | OSCAR | 2018-11-04 06:00:00 | NaN | EX | 60.8 | -12.1 | 40.0 | 973.0 |
| 53218 | AL162018 | OSCAR | 2018-11-04 12:00:00 | NaN | EX | 62.4 | -9.1 | 40.0 | 977.0 |
You can check your solution by using the to_csv method and comparing against this file or your output from Part 1. Use the index=False option so that the index is not saved. (See instructions for checking the solution in the Details section).
Extra Credit
CS 490 Students may complete the latitude/longitude parts. All students may investigate using Foofah to try to process this data. The source code is available here. It may be best to work with a subset.