Assignment 2
Goals
The goal of this assignment is to learn how to use pandas for data analysis tasks.
Instructions
You may choose to work on this assignment on a hosted environment (e.g. Azure Notebooks or Google Colab) or on your own local installation of Jupyter and Python. You should use Python 3.6 or higher for your work. To use cloud resources, you should be able to login with your NIU credentials to Azure Notebooks or create/login to a free Google account for Colab. If you choose to work locally, Anaconda is the easiest way to install and manage Python. If you work locally, you may launch Jupyter Lab either from the Navigator application or via the command-line as jupyter-lab.
In this assignment, we will analyze the HURDAT2 dataset for Atlantic hurricane data from 1851 through 2017. This dataset is provided by the National Hurricane Center and is documented here. We will do similar types of analysis as in Assignment 1 but now using pandas.
Due Date
The assignment is due at 11:59pm on Friday, February 7.
Submission
You should submit the completed notebook file required for this assignment on Blackboard. The filename of the notebook should be a2.ipynb. Please use Markdown headings to clearly separate your work for each of the parts. Also make sure that your notebook runs correctly before handing it in using the “Run All” command to run all of the cells in top-down order.
Details
In this assignment, we will use the same hurricane data, but in a cleaned up CSV format. You can download the hurdat2.csv data here. In addition, you may use the following code in your notebook to download the file so it is available for further work:
import os
from urllib.request import urlretrieve

# download the data if we don't have it locally
url = "http://faculty.cs.niu.edu/~dakoop/cs680-2020sp/a2/hurdat2.csv"
local_fname = "hurdat2.csv"
if not os.path.exists("hurdat2.csv"):
    urlretrieve(url, local_fname)
Each data item is a specific point along the hurricane’s trajectory, and unlike in the original data, every data item contains the hurricane’s identifier and name. The beginning of this file looks like:
identifier,name,num_pts,record_id,status,latitude,longitude,max_wind,min_pressure,datetime
AL011851,UNNAMED,14,,HU,28.0,-94.8,80,-999,1851-06-25T00:00:00
AL011851,UNNAMED,14,,HU,28.0,-95.4,80,-999,1851-06-25T06:00:00
AL011851,UNNAMED,14,,HU,28.0,-96.0,80,-999,1851-06-25T12:00:00
and the fields are:
identifieris a unique identifier for each hurricanenameis the hurricane’s name orUNNAMEDnum_ptsis the number of points recorded for the hurricanerecord_idis the record identifier as defined by the documentationstatusis the status of the system as defined by the documentationlatitudeis the latitude of the recorded pointlongitudeis the longitude of the recorded pointmax_windis the maximum sustained wind (in knots)min_pressureis the minimum pressure (in millibars), -999 if this was not measureddatetimeis the date and time of the recorded point (in Coordinated Universal Time (UTC))
1. Hurricane Names (15 pts)
We again wish to compute the number of unique hurricane names and the most frequently used name. First, we must load the data. Pandas has a read_csv method that will load a dataset into a DataFrame object. Recall that we have the hurricane’s name and identifier repeated for each point it was tracked in this dataset. For this part of the analysis, we do not want to have these repeats. Pandas allows us to remove them by (a) projecting the hurricanes to just the identifiers and names and (b) removing duplicates. For (a), you can select a subset of columns using brackets, and multiple columns using a list inside the brackets. For example,
creates a new dataframe new_df with only columns col1 and col2. For (b), you can use the drop_duplicates method.
a. Number of Unique Hurricane Names
Using your projected, de-duped data frame, compute the number of unique hurricane names. Remember to remove UNNAMED!
b. Most frequently used name
Using the same data frame, compute the most frequently used name.
Hints
- You can remove “UNNAMED” using a boolean index
- The
value_countsmethod is useful for counting the occurrences of values.
2. Year with the Most Hurricanes (10 pts)
Now, we need the year with the most hurricanes. Here, we need to have some way to extract the year from the rest of the data. There are (at least) two ways to do this: (a) extract it from the identifier, and (b) extract it from the datetime. For (a), we use pandas string methods on an entire column at once. For example, df.col1.str[:2] extracts the first two characters of col1. For (b), we need to ensure that datetime is understood as a pandas datetime type. This can be accomplished by converting a column using pd.to_datetime method and then using the .dt accessor. For example, pd.to_datetime(col1).dt.month converts a column to datetime and then extracts the month.
In both cases, we need to create a new column to store the year. Once you have done this, drop the duplicates to ensure we don’t double-count hurricanes and count the number of occurrences per year.
Hints
- In addition to
value_counts, you can use themaxmethod to take just the highest value.
3. Minimum latitude and Minimum pressure (15 pts)
Now, we will use all of the points that were tracked for the hurricanes to find the hurricane with the maximum latitude and minimum pressure. This time, we don’t need to worry about dropping duplicates. However, if we just use the max and min descriptive statistics, we will only get the values instead of the details about the hurricane name and year. We can either use boolean indexing to find matching values or use the idxmin or idxmax methods to obtain the index of the row that achieves the maximum and then pull out that row.
a. Farthest South Hurricane Name and Year
Find the name, year, and latitude of the hurricane that was tracked farthest south.
b. Hurricane with Minimum Pressure
Find the name, year, and pressure of the hurricane that had minimum pressure. Make sure to exclude -999 values!
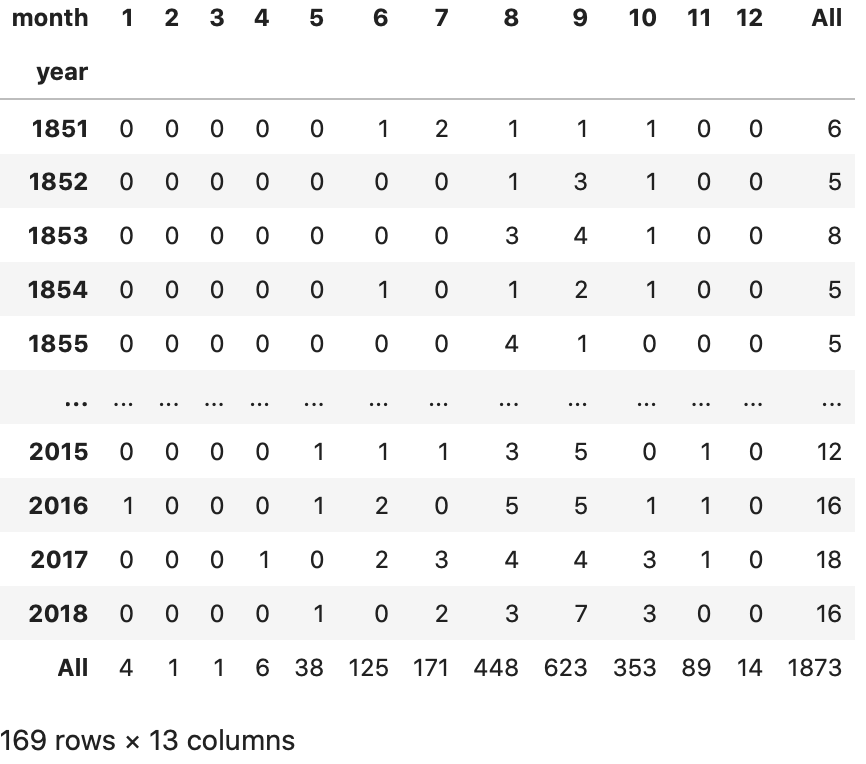
4. Year-month Crosstab (15 pts)
Pandas features crosstabs so that we can also create a table to analyze the number of hurricanes over years and months. Here, we need the ability to extract both year and month so option (b) from Part 2 is best. Then, the pd.crosstab method allows us to pass in both year and month to obtain the table. Add margins=True to get subtotals for rows and columns.
5. [CS680 Students] Incorrect Values (20 pts)
The dataset is mostly correct, but there are a couple of interesting errors.
a. Incorrect Status (7 pts)
There is (at least) one error with one of the entries in the status column. Consult the documentation to see which hurricane status codes are allowed, and find both the anomalous code and the name & year of the hurricane that was incorrectly tagged.
b. Incorrect Max Wind Flag (13 pts)
Check the record_id codes in the documentation. One of those codes flags the time that the hurricane reached its maximum sustained wind speed. However, one of the hurricanes has a reported maximum sustained wind speed (the max_wind column) that is higher than the flagged record. Identify the hurricane as well as that hurricane’s real maximum wind speed.
Extra Credit
CS 490 students may complete Part 5 for Extra Credit.