Assignment 4
Goals
Learn to create map visualizations and apply colormaps.
Instructions
There are three parts to the assignment. You may complete the assignment in a single HTML file or use multiple files (e.g. one for CSS, one for HTML, and one for JavaScript). You must use D3 v5 for this assignment. All visualization should be done using D3 calls except where instructed otherwise. You may use other libraries (e.g. underscore.js or jQuery), but you must credit them in the HTML file you turn in. Extensive documentation for D3 is available, and Vadim Ogievetsky’s example-based introduction that we went through in class is also a useful reference. In addition, Scott Murray’s Interactive Data Visualization for the Web is a good reference. This D3 Map Example may also help.
Due Date
The assignment is due at 11:59pm on Friday, November 1.
Submission
You should submit any files required for this assignment on Blackboard. You may complete the assignment in a single HTML file or use multiple files (e.g. one for HTML, one for CSS, and one for JavaScript). Note that the files should be linked to the main HTML document accordingly. The filename of the main HTML document should be a4.html. Blackboard may complain about the files; if so, please zip the files and submit the zip file instead.
Details
In this assignment, we will examine Illinois farming data by county. This data comes from the USDA’s Census of Agriculture through the QuickStats service. Specifically, we are interested in how much of each county has been used for farming over the past couple decades. This data has been extracted and is available online. To create maps, we will use [Illinois county boundaries]((https://clearinghouse.isgs.illinois.edu/data/reference/illinois-county-boundaries-polygons-and-lines)s as specified by the Illinois State Geological Survey. This shapefile has been converted to the GeoJSON format that D3 can more easily handle. In addition, the boundaries have been simplified. The goal of the assignment is to understand farmland across the state and examine any spatial trends over time.
Data Links
- IL County Boundaries GeoJSON: https://gist.githubusercontent.com/dakoop/2d6f78f5bbe75c0cea60cd7dfec3bb39/raw/dbb35c139c5147e14b2971835948d0af8362ed68/il-counties.geojson
- IL Farming Data: https://gist.githubusercontent.com/dakoop/2d6f78f5bbe75c0cea60cd7dfec3bb39/raw/dbb35c139c5147e14b2971835948d0af8362ed68/il-farm-acres.json
- Full Gist: https://gist.github.com/dakoop/2d6f78f5bbe75c0cea60cd7dfec3bb39
0. Info
Like Assignment 1, start by creating an HTML web page with the title “Assignment 4”. It should contain the following text:
- Your name
- Your student id
- The course title (“Data Visualization (CSCI 490/680)”), and
- The assignment title (“Assignment 4”)
- The text “This assignment is all my own work. I did not copy the code from any other source.” (Your inclusion of this text indicates that you understand the consequences of violating the NIU Academic Integrity Standards.)
If you used any additional JavaScript libraries or code references, please append a note to this section indicating their usage to the text above (e.g. “I used the jQuery library to write callback functions.”) Include links to the projects used. You do not need to adhere to any particular style for this text, but I would suggest using headings to separate the sections of the assignment.
A template for the assignment is provided: html, js; save them both as source. You may use this or create your own files.
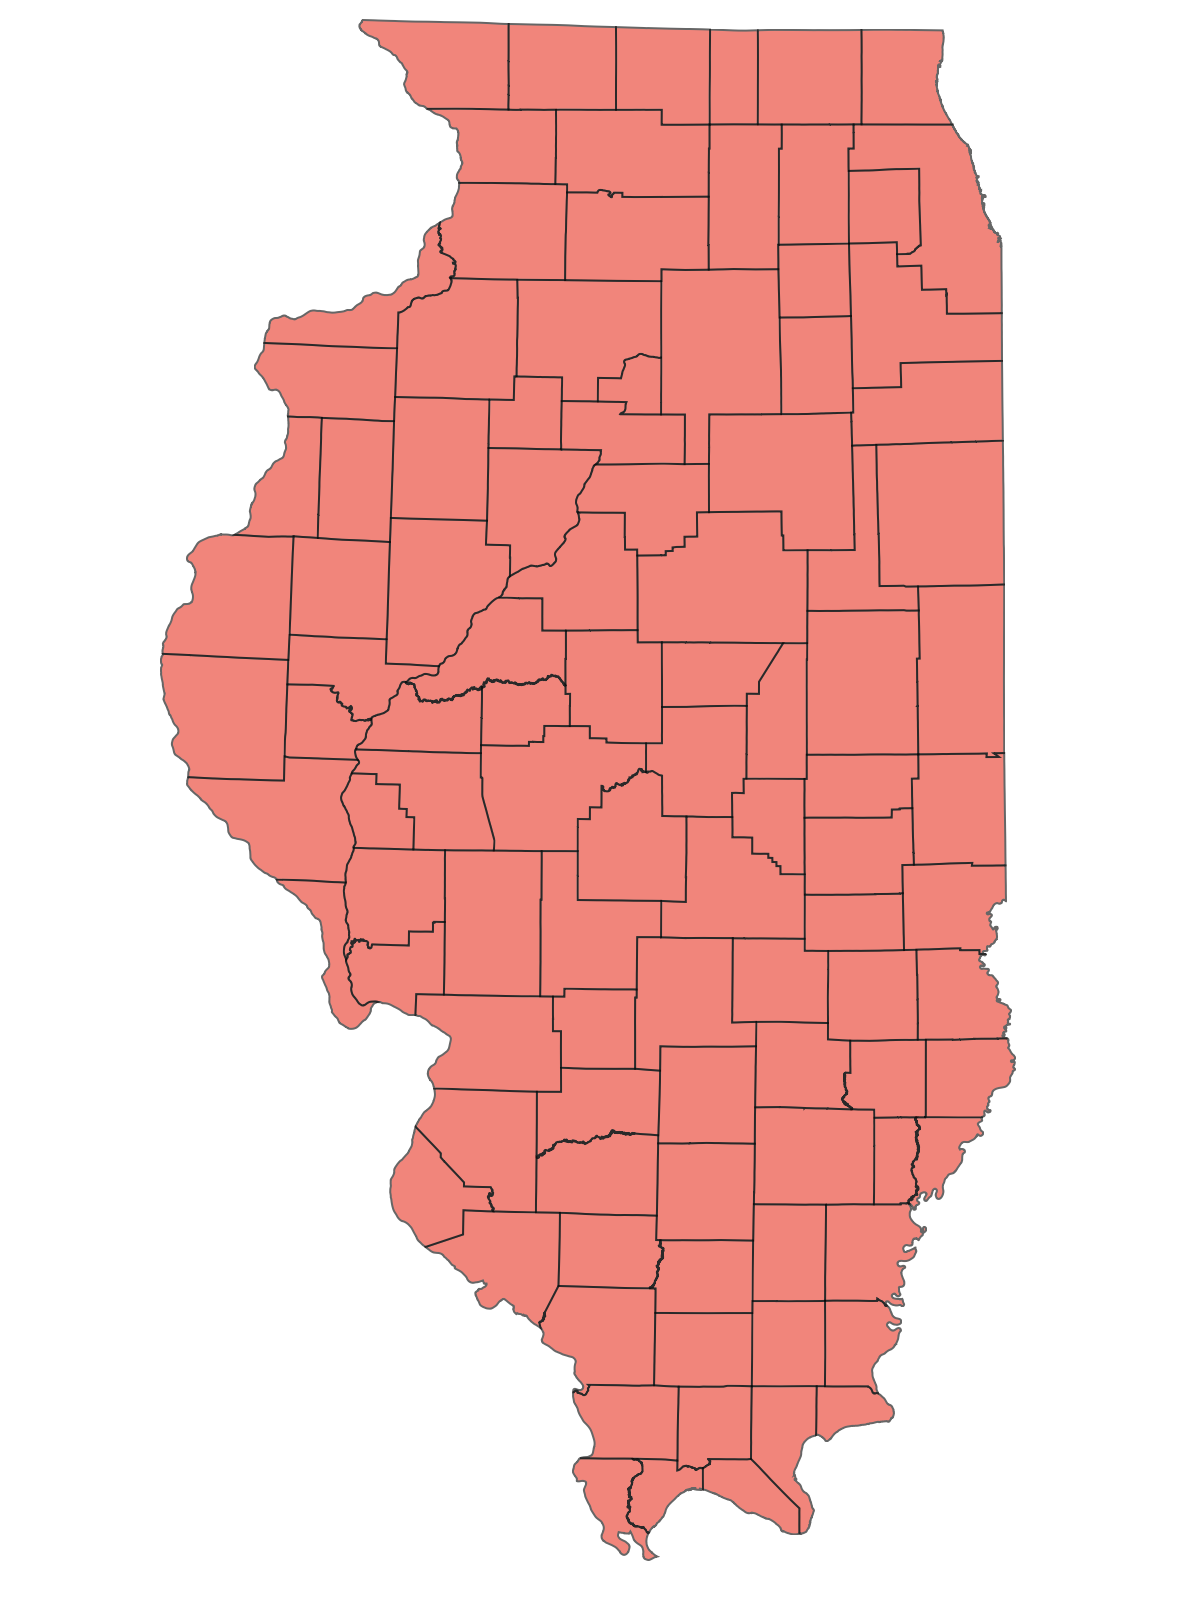
1. IL County Map (30 pts)
Create a map that shows the county boundaries. You will only need the GeoJSON data for this part of the assignment.
Remember that you will need a projection for the map. For this assignment, we will use the Illinois East State Plane projection. Noah Veltman has provided a handy list of these in d3.geo format here.
For the map, you will want to use each county as a separate feature. Thus, you should use mapData.features with the normal selection plus data binding. Each feature has a number of properties that will be useful for the next steps. If you wish, you could implement a tooltip using the COUNTY_NAM attribute (note the missing “E”) to show a county’s name (for a data item d, this is stored in d.properties.COUNTY_NAM). You can load the mapData via d3.json. Note that this is an asynchronous call, and you should use promises to call the function to draw the map after the data is loaded.
Hints
- Each district is a feature so if
mapDatais the variable loaded byd3.json,mapData.featuresis a list of all of the towns. d3.geoPathcan have an associated projection is used to translate GeoJSON features into paths on screen.
2. IL Farmland by County (40 pts)
You will create two visualizations, but you should work to create a single function to facilitate most of the work, passing data accessor functions and color scales as necessary. Do note that it may be easier to first create the visualizations individually and then refactor them.
a. Proportion of Farmland in 2017 (20 pts)
Using the farming data in concert with the GeoJSON data, create a new choropleth map that shows the proportion of farmland in each county. The colormap should accurately convey the proportion of farmland. Create a legend so a viewer can understand the values. Note that both the land area and farmland area for different years (in acres) are provided, but you need to calculate the proportion.
You will need to match the data in the GeoJSON file with the data in the farming JSON file. Given a GeoJSON feature f, the COUNTY_NAM) is accessed from the properties object as f.properties.COUNTY_NAM. This can be matched with the keys in the JSON file.
Finally, to load multiple external data files using D3, use Promise.all. To load two JSON files file1.json and file2.json, you would have the following code:
b. Change in Farmland from 2007 to 2017 (20 pts)
Create a second choropleth visualization, but now show the change in the proportion of farms from 2007 to 2017. It should be clear from the visualization whether the proportion increased or decreased and by how much. This will be a different colormap than in part a.
Hints
- If you craft your function to create the map in Part 1 well, you can use reuse that function and just update the fill based on the farmland data.
d3.scaleSequentialcan help with colormapping. Remember to check the type of the values you are displaying to determine a correct colormap.- To create a good colormap, think about what the domain of the values is.
- To create a nice legend, consider using (with proper attribution) M. Bostock’s color ramp approach.
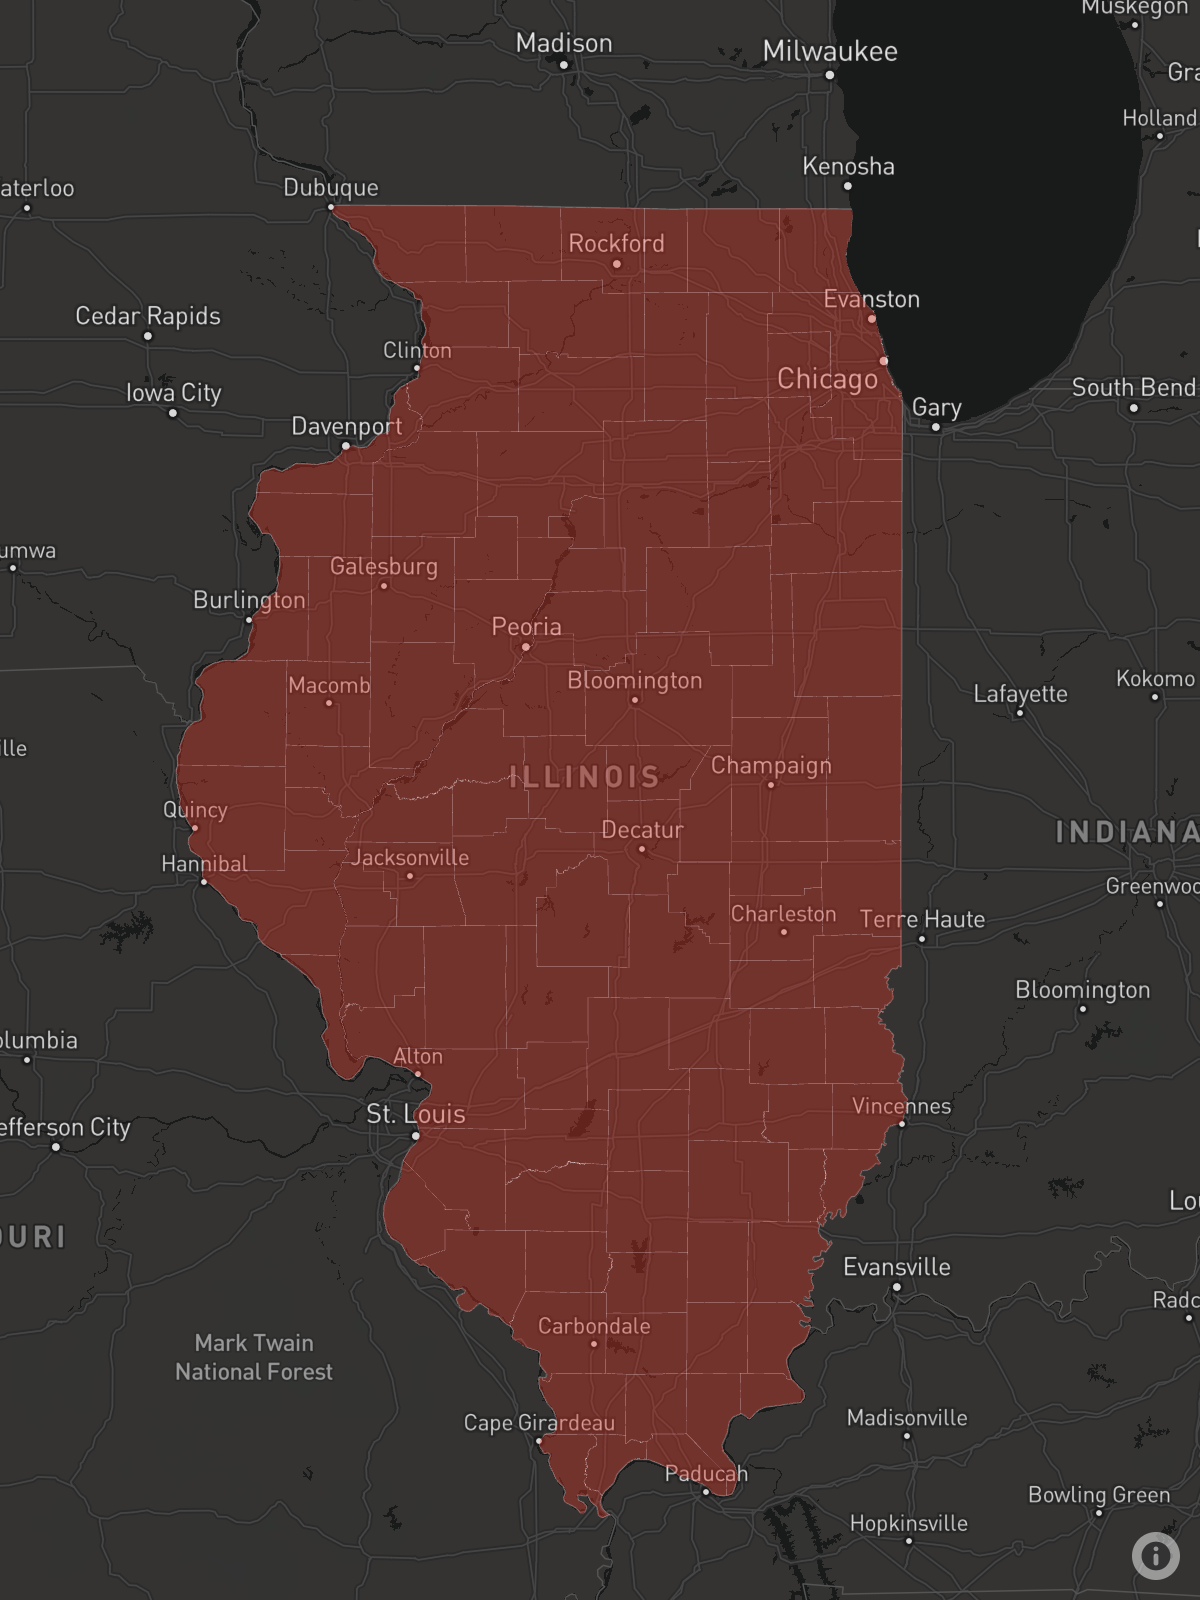
3. [CS 680 Only] Overlay (30 points)
While these maps are useful if you are familiar with Illinois geography, it can be difficult to tell what features are covered by particular counties. Web mapping technologies (e.g. Leaflet, MapboxGL) can display features like towns, highways, parks, etc., using map tiles. We can use D3 to overlay the farming information (from Part 2b) on top of such maps so that we can explore the county boundaries and farming trends in relationship to other features. It is also possible to create native choropleth layers using routines in libraries like deck.gl (these also exist for leaflet and MapboxGL). You may choose to do one of:
- Create a D3 overlay for MapboxGL
- Create a D3 overlay for Leaflet
- Create a choropleth using deck.gl’s native layers
All of these libraries are open-source but MapboxGL requires a developer access token. To use Mapbox layers (also in deck.gl), you need to sign up for a free account that will provide you with a token that allows 50,000 map views per month. This should be sufficient for your work on this assignment. Sign up for an account. Your token is visible here in your account here.
In options 1 and 2, we will still create an SVG, but this SVG will sit on top of the map from Leaflet or MapboxGL. You will need to create an SVG for the overlay. In Leaflet, you can use the built-in overlay pane (map.getPanes().overlayPane), and in MapboxGL, you can add the svg to the canvas container (map.getCanvasContainer()). We will update D3’s paths when a user moves or zooms in on the map. This is done using a point geoTransform that uses the underlying map’s projection information. Here is some example code based on Mike Bostock’s work assuming map is the existing map object:
    function projectPoint(lng, lat) {
        let point = map.latLngToLayerPoint(new L.LatLng(lat, lng));
        this.stream.point(point.x, point.y);
    }

    transform = d3.geoTransform({point:projectPoint});
    path = d3.geoPath().projection(transform);
For MapboxGL, replace the second line with
Note that the order of latitude and longitude is swapped!. Then, projectPoint must be called whenever the map view is changed (generally, the viewreset, move, and movestart events). For Leaflet, you also need to update some transformations (see the render function in this example).
For deck.gl, refer to the GeoJSONLayer example but note that is in 3D and we want a 2D choropleth. In addition, if you use D3’s color scale support, note that deck.gl expects an array with the RGB values, not a string. You can convert using d3.rgb and extracting the r, g, and b fields. Also, note that you should specify a container and the map information including the Mapbox access token and style. Note that for this option, you will not need to handle interactions because the layers are handled by deck.gl.
Hints
- Draw a standard Leaflet, MapboxGL, or deck.gl map first and then figure out how to add the choropleth layer
- Set the initial position and zoom so that Illinois is initially visible and fills the frame
- Remember to also include CSS stylesheets: Leaflet, MapboxGL.
- In Leaflet, latitude is first, in MapboxGL, longitude is first.
- Set the
position: absoluteCSS rule for the svg layer and usez-indexstyle to position the svg over the map - The event
.on(...)callbacks take the name of the event and a callback function. The callback function needs to recreate each path’sdattribute, and, for Leaflet, update the transformations.
Extra Credit
For extra credit, CS 490 students may complete Part 3. In addition, all students may implement a way for users to interactively update which year (or year range) is shown (year for Part 2a, range for Part 2b or Part 3). Use D3 transitions to animate the change from one year (or year range) to the other.