Final Exam
Date, Time, & Location
Monday, December 9, 12:00-1:50pm, PM 103
Overview
The final exam will be cumulative, including all the material from the beginning of the semester through the end, but it will emphasize material since the Midterm. The chapters of the textbook covered include 1-13, although we did not go into much detail on Ch. 4 and went into more detail on Ch. 8 (geospatial visualization and scientific visualization). In addition, the exam will cover HTML, CSS, SVG, and D3 concepts, including the understanding of code. If you are required to write code, I will only require pseudocode—the exact syntax is not required. CS 627 students will have additional questions and may be asked about papers discussed in class.
Links to Papers [CS 627]
- Papers from first half of course
- Hierarchical Edge Bundles: Visualization of Adjacency Relations in Hierarchical Data, D. Holten, 2006.
- Cushion Treemaps: Visualization of Hierarchical Information, J. J. van Wijk and H. van de Wetering, 1999.
- Squarified Treemaps, M. Bruls et al., 1999.
- Sketching Designs Using the Five Design-Sheet Methodology, J. Roberts et al., 2016.
- Animated Transitions in Statistical Data Graphics, J. Heer and G. G. Robertson, 2007.
- Exploring the Design Space of Composite Visualization, W. Javed and N. Elmqvist, 2012.
- Probing Projections: Interaction Techniques for Interpreting Arrangements and Errors of Dimensionality Reductions, J. Stahnke et al., 2015
Format
- Multiple Choice
- Free Response
Example Types of Free-Response Questions
- Multiple-View Visualization Identify the strategy used to address complexity in the given visualization (e.g. juxtaposition, superimposition, nesting). What are the pros and cons of this strategy?
- Aggregation. When doing spatial aggregation, what issue do you need to be aware of?
- Filtering. How do scented widgets help with filtering?
- Scientific Visualization. Identify the grid type? (e.g. uniform, rectilinear, structured, unstructured) What type of data is probably being shown? (e.g. scalar or vector). What visualization techniques are being used? If I wanted to show scalar data in an existing vector field visualization, what visual channel might I use?
- Focus+Context. How does distortion help users visualizing data? How might distortion cause problems?
- Design. Given the following data, how would you create a visualization that allows a user to look for spatial trends? (Be specific about marks, channels, and visualization types.)
- D3. Given some code, draw the output. If I now run code that triggers an update, determine the final state of the visualization (Identify the enter, exit, and update parts of the selection.)
- D3. Given some marks, how do I highlight the currently selected one?
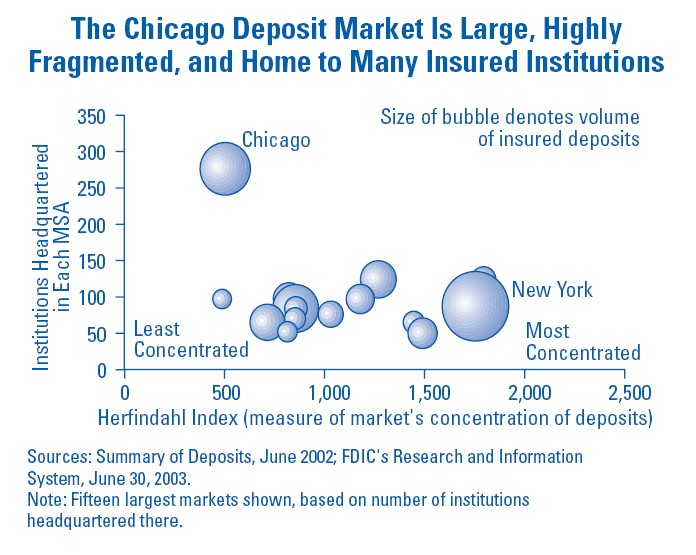
- Marks & Channels. What are the marks and channels in
the following visualization? What is a problem with this visualization?

CS 627 Example Questions
- Treemaps. + What problem with slice-and-dice treemaps does squarified treemaps address? What problem with with treemaps with no shading do cushioned treemaps address?
- Animation. What did Heer and Robertson test with respect to animation? What did their results show?
- Networks. What problem does edge bundling address? Why is the hierarchical nature of this important?