Assignment 1
Goals
Get started (or continue) with Web languages. This assignment will introduce (or reintroduce) you to HyperText Markup Language (HTML), Cascading Style Sheets (CSS), and Scalable Vector Graphics (SVG). While not required, I recommend completing this assignment using Observable. You will receive an invitation to join the NIU Observable Team via your NIU email; please contact me if you did not receive this invitation by Wednesday, Sept. 4.
Instructions
There are three parts for this assignment. You may complete the assignment in a single HTML file or use multiple files (e.g. one for CSS and one for HTML). You may not use external libraries for Parts 1 & 2 but may use D3 and Observable Plot for Part 3. The Mozilla Developer Network documentation serves as a great reference for the technologies involved in this assignment. In addition, Scott Murray’s Interactive Data Visualization for the Web is a useful reference (see Chapter 3).
You may choose to work in any environment, but make sure you turn in an output that works in the browser. I recommend using Observable to complete your work, but you may choose to work in another environment. If you work in Observable, please note that your style rules will need to be inlined in the document (not as separate css files). In addition, style rules are global, applied across the entire notebook, so use id attributes in your style rules to limit the extent of the rules. You can use HTML type cells for Parts 1 and 2, and a JavaScript cell for Part 3.
Due Date
The assignment is due at 11:59pm on Wednesday, September 11.
Submission
You should submit any files required for this assignment on Blackboard. For Observable, do
not publish your notebook; instead, (1) share it with me
(@dakoop) and (2) use the “Export -> Download Code”
option and turn in that .tar.gz file to Blackboard. Please
do both of these steps as (1) is easier for me to grade, but (2) makes
it possible to persist the state of the submission. Do
not share the code publicly. If you complete the assignment
outside of Observable, you may complete the assignment in a single HTML
file or use multiple files (e.g. one for HTML and one for CSS). Note
that the files should be linked to the main HTML document accordingly in
a relative manner (style.css
not
C:\My Documents\Jane\NIU\CSCI627\assignment1\styles.css).
If you submit multiple files, you may need to zip them in order for
Blackboard to accept the submission. The filename of the main HTML
document should be a1.html.
Details
1. Info (HTML & CSS) (15 pts)
Create an Observable Notebook or HTML web page with the title “Assignment 1”. Then add a section that contains the following items:
- Your name
- Your student id
- The course title (“Data Visualization (CSCI 627/490)”), and
- The date (“2024-09-11”)
Use the following html to structure this information:
<div id="info">
  <div class="left">
    <!-- Your Name & Z-ID -->
  </div>
  <div class="right">
    <!-- Class Title & Assignment -->
  </div>
</div>
All of the lines you add should be heading
elements. The first line (your name) should be larger than the
others. Do not add anything except the header tags (with
id and class attributes only) and the text in
HTML. Two lines should be added the
<!-- Your Info --> section and two lines to the
<!-- Class Info --> section.
Style the text using CSS so that your name and student id are displayed in the same color (not black or white), and the course title and assignment due date are italicized but not bold. Your name and student id should be on the left side of the page while the course title and assignment due date should be on the right side of the page and the text aligned to the right. Add a rectangle (or rounded rectangle) around the class title and assignment due date. You must do this using CSS; do not use any HTML attributes except id and class!
Hints
- Think about using either a
classattribute or cascading to reduce the number of rules - Consider using the Flexible Box Layout to achieve left- and right- alignment.
- The
borderandpaddingproperties will be useful for outlining a region. - Header items will be bold by default so you will need to override
this (see
font-weight).

2. Lighted Room (SVG & CSS) (20 pts)
In the same web page, write markup that creates an SVG graphic that displays a room with a hanging circular light using SVG. (You may not use an illustration program to generate the SVG!) Your graphic should have a room shaped as a pentagon.a light hanging from the ceiling, a couch in the middle of the room facing the viewer, and a light switch on the side of the room. The couch, light, and switch must be colored differently than the rest of the room. The couch must have at least two sections (seats) and have arms; use rectangles with rounded corners for the cushions. The light must be circular with a shade that is a half circle, and there should be a wire (line) from the ceiling to hold it. The light switch should have a smaller switch on top of a baseplate. Finally, write CSS so that when the mouse is hovering over the switch (the plate or the toggle), the light changes from a dark color to a bright color. You may be creative! Feel free to add other elements (a table, piece of artwork) to the room.
You may only use SVG lines, polylines, rectangles, circles, polygons, or paths. You should draw all content in a single svg element. Use css to style the elements. For example,
<svg id="room" width="300" height="300">
   <!-- YOUR SVG HERE -->
</svg>
Hints
- Remember that SVG coordinates start from the top-left part of the element.
- The order of the SVG elements determines how they appear. This can be useful when drawing the light as the cover can occlude part of the bulb.
- You can style SVG elements with CSS in a similar manner to HTML elements.
- This writeup provides a nice overview of the components of drawing an arc using svg.
- Investigate the SVG fill and stroke attributes to style the elements of the room.
- Examine the documentation to determine how to round the corners of a rectangle.
- The
:hoverpsuedo-class will be useful for detecting when the mouse is over the button. Then, use the sibling combinator (~) to target the light circle.
Example Solution
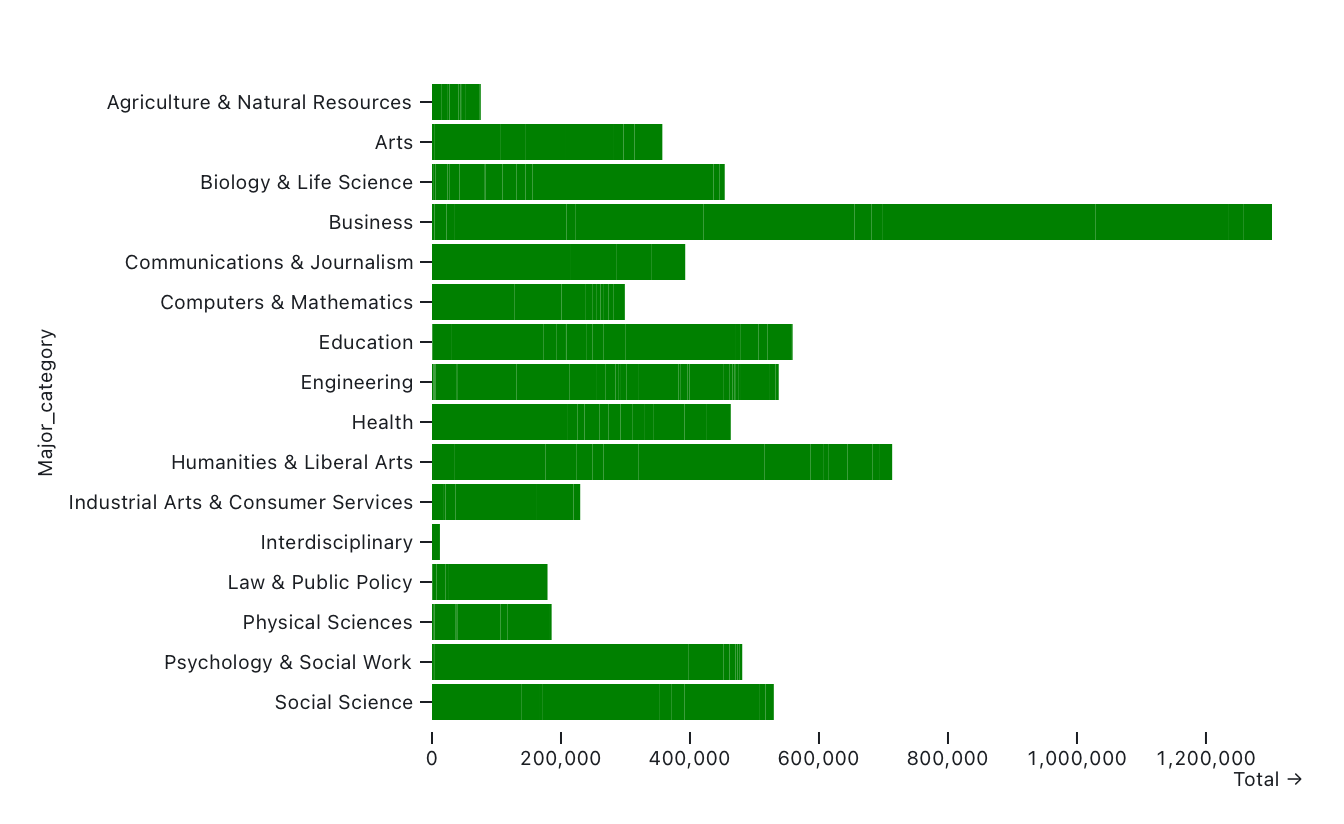
3. Bar Chart (Plot) (15 pts)
Now, we will use Observable Plot to create a bar chart showing the
number of graduating college majors in different fields a decade ago.
The dataset
was collected and cleaned by FiveThirtyEight.
We will be using the recent_grads.csv file which contains a
variety of information about college graduates by their major. The goal
is to generate a bar chart that shows the major categories along the
y-axis and the total graduates in that category along the x-axis. Use
the examples in this notebook
along with the dataset to create the bar chart.
Observable automatically imports the d3 and Plot libraries so you can
use them directly. However, if you are using another tool for this
assignment, make sure to include these two libraries. See the documentation
about how to include them, specifically about how to use them in vanilla
HTML or as a UMD bundle. To load the data, use d3.csv
which can load the data from the URL https://raw.githubusercontent.com/fivethirtyeight/data/master/college-majors/recent-grads.csv.
You should only need two statements to create the bar chart, one to load
the data and the other to plot it.
Hints
- To make the category names legible, use the margin options