Assignment 1
Goals
Get started (or continue) with Web languages. This assignment will introduce (or reintroduce) you to HyperText Markup Language (HTML), Cascading Style Sheets (CSS), and Scalable Vector Graphics (SVG). While not required, I recommend completing this assignment using Observable.
Instructions
There are three parts for this assignment. You may complete the assignment in a single HTML file or use multiple files (e.g. one for CSS and one for HTML). You may not use external libraries for Parts 1 & 2 but may use D3 and Observable Plot for Part 3. The Mozilla Developer Network documentation serves as a great reference for the technologies involved in this assignment. In addition, Scott Murray’s Interactive Data Visualization for the Web is a useful reference (see Chapter 3).
You may choose to work in any environment, but make sure you turn in
an output that works in the browser. I recommend using Observable to complete your work,
but you may choose to work in another environment. If you work in
Observable, please note that your style rules will need to be inlined in
the document (not as separate css files). In addition, style rules are
global, applied across the entire notebook, so use id
attributes in your style rules to limit the extent of the rules. You can
use HTML type cells for Parts 1 and 2, and a JavaScript cell for Part 3.
On Observable, do not publish your notebook; instead use the “Export
-> Download Code” option and turn in that .tar.gz file
to Blackboard.
Due Date
The assignment is due at 11:59pm on Tuesday, September 6.
Submission
You should submit any files required for this assignment on Blackboard. You may complete the
assignment in a single HTML file or use multiple files (e.g. one for
HTML and one for CSS). Note that the files should be linked to the main
HTML document accordingly in a relative manner
(style.css not
C:\My Documents\Jane\NIU\CSCI627\assignment1\styles.css).
If you submit multiple files, you may need to zip them in order for
Blackboard to accept the submission. The filename of the main HTML
document should be a1.html.
Details
1. Info (HTML & CSS) (15 pts)
Create an Observable Notebook or HTML web page with the title “Assignment 1”. Then add a section that contains the following items:
- Your name
- Your student id
- The course title (“Data Visualization (CSCI 627/490)”), and
- The date (“2022-09-06”)
Use the following html to structure this information:
<div id="info">
  <div class="left">
    <!-- Your Name & Z-ID -->
  </div>
  <div class="right">
    <!-- Class Title & Assignment -->
  </div>
</div>
All of the lines you add should be heading
elements. The first line (your name) should be larger than the
others. Do not add anything except the header tags (with
id and class attributes only) and the text in
HTML. Two lines should be added the
<!-- Your Info --> section and two lines to the
<!-- Class Info --> section.
Style the text using CSS so that your name and student id are displayed in the same color (not black or white), and the course title and assignment due date are italicized but not bold. Your name and student id should be on the left side of the page while the course title and assignment due date should be on the right side of the page and the text aligned to the right. Add a rectangle (or rounded rectangle) around the class title and assignment due date. You must do this using CSS; do not use any HTML attributes except id and class!
Hints
- Think about using either a
classattribute or cascading to reduce the number of rules - Consider using the Flexible Box Layout to achieve left- and right- alignment.
- The
borderandpaddingproperties will be useful for outlining a region. - Header items will be bold by default so you will need to override
this (see
font-weight).

2. Tower (SVG & CSS) (20 pts)
In the same web page, write markup that creates an SVG graphic that displays a tower using SVG. Your tower should have two levels, one base tower with windows and then a few narrower floors near the top, a triangular spire at the top, and a blinking red beacon atop the spire. The beacon should use animation to cycle the color from on (red) to off. You should have at least nine windows, and those windows should be a different color than the tower and have frames (borders) that are a different color than both the tower and the window. You may choose to customize the tower however you wish (e.g. colors, other features, etc.). Your solution must have the elements described above but does not need to match the example solution.
You may only use SVG lines, polylines, rectangles, circles, polygons, or paths. You should draw all content in a single svg element. For example,
<svg id="tower" width="250" height="400">
   <!-- YOUR SVG HERE -->
</svg>
The red beacon is best created using css animation (which should work
with svg elements). This
example shows how to change opacity, but you will need to update the
rules to change the fill color instead. While not required, you can
choose to write code (e.g. using Observable’s template literals)
to create the 9+ windows programmatically. Note that in Observable, an
HTML cell natively supports templates (${...}) without the
extra html` prefix.
Hints
- Remember that SVG coordinates start from the top-left part of the element.
- The order of the SVG elements determines how they appear.
- You can style SVG elements with CSS in a similar manner to HTML elements.
- Investigate the SVG fill and stroke attributes to style the tower pieces (including the windows).
- You may choose to style the spire and building using a single rule.
- MDN has more information on CSS Animations
- See this post for an example of building multiple elements at once.
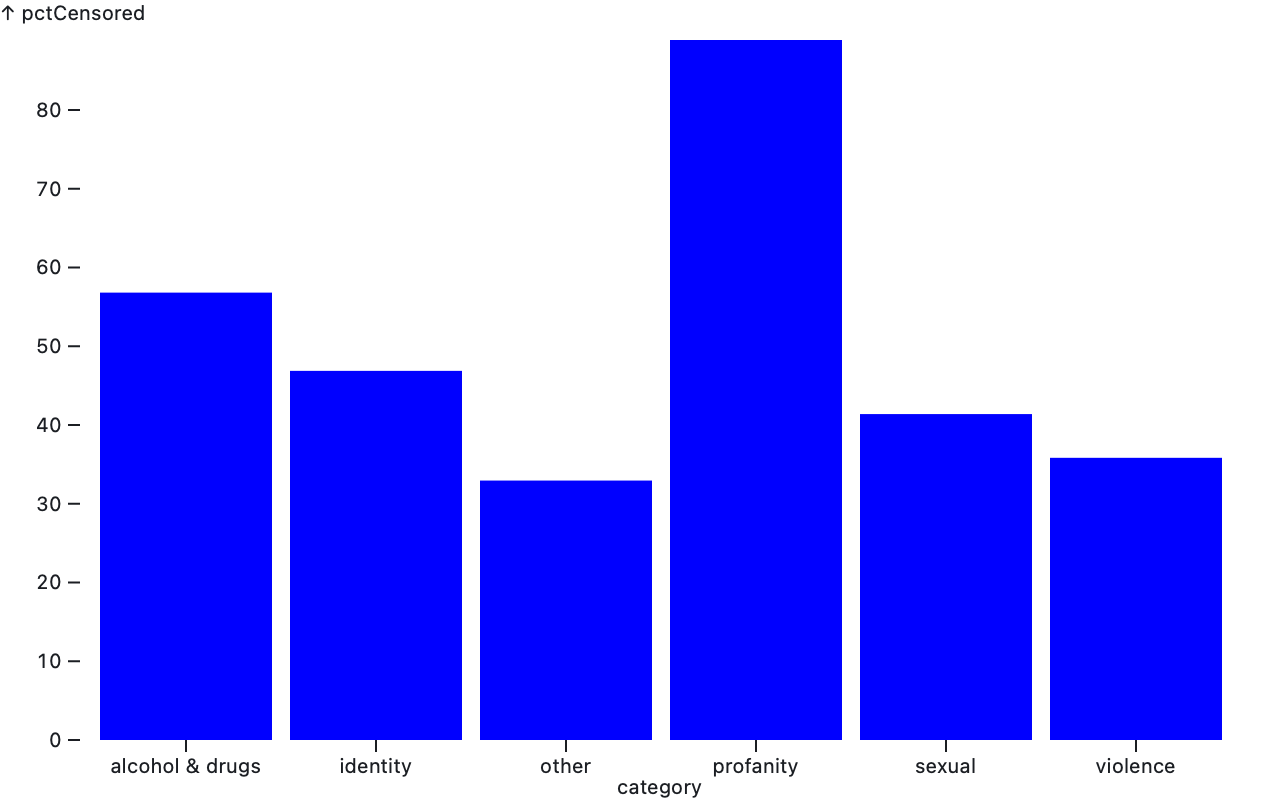
3. Bar Chart (Plot) (15 pts)
Now, we will use Observable Plot to create a bar chart showing which
types of words are censored by KidzBop as explored by The Pudding. The dataset
is available here. We will be using the
KB_group-overview.csv file which calculates the percentage
of words belonging to each category that are censored. The goal is to
generate a bar chart that shows the categories along the x-axis and the
percentage on the y-axis. Use the examples in this notebook
along with the KidzBop dataset to create the bar chart.
Observable automatically imports the d3 and Plot libraries so you can
use them directly. However, if you are using another tool for this
assignment, make sure to include these two libraries. See the documentation
about how to include them, specifically about how to use them in vanilla
HTML or as a UMD bundle. To load the data, use d3.csv
which can load the data from the URL https://raw.githubusercontent.com/the-pudding/data/master/kidz-bop/KB_group-overiew.csv.
You should only need two statements to create the bar chart, one to load
the data and the other to plot it.