Assignment 5
Goals
Interaction and Linked Views in D3
Instructions
There are three parts to the assignment. You may complete the assignment in a single HTML file or use multiple files (e.g. one for CSS, one for HTML, and one for JavaScript). You must use D3 v6 for this assignment. All visualization should be done using D3 calls. You may use other libraries (e.g. lodash.js or jQuery), but you must credit them in the HTML file you turn in. Extensive documentation for D3 is available, and Vadim Ogievetsky’s example-based introduction that we went through in class is also a useful reference. In addition, Scott Murray’s Interactive Data Visualization for the Web is a good reference.
Due Date
The assignment is due at 11:59pm on Monday, November 23.
Submission
You should submit any files required for this assignment on Blackboard. You may complete the assignment in a single HTML file or use multiple files (e.g. one for HTML, one for CSS, and one for JavaScript). Note that the files should be linked to the main HTML document accordingly. The filename of the main HTML document should be a5.html. Blackboard may complain about the files; if so, please zip the files and submit the zip file instead.
Details
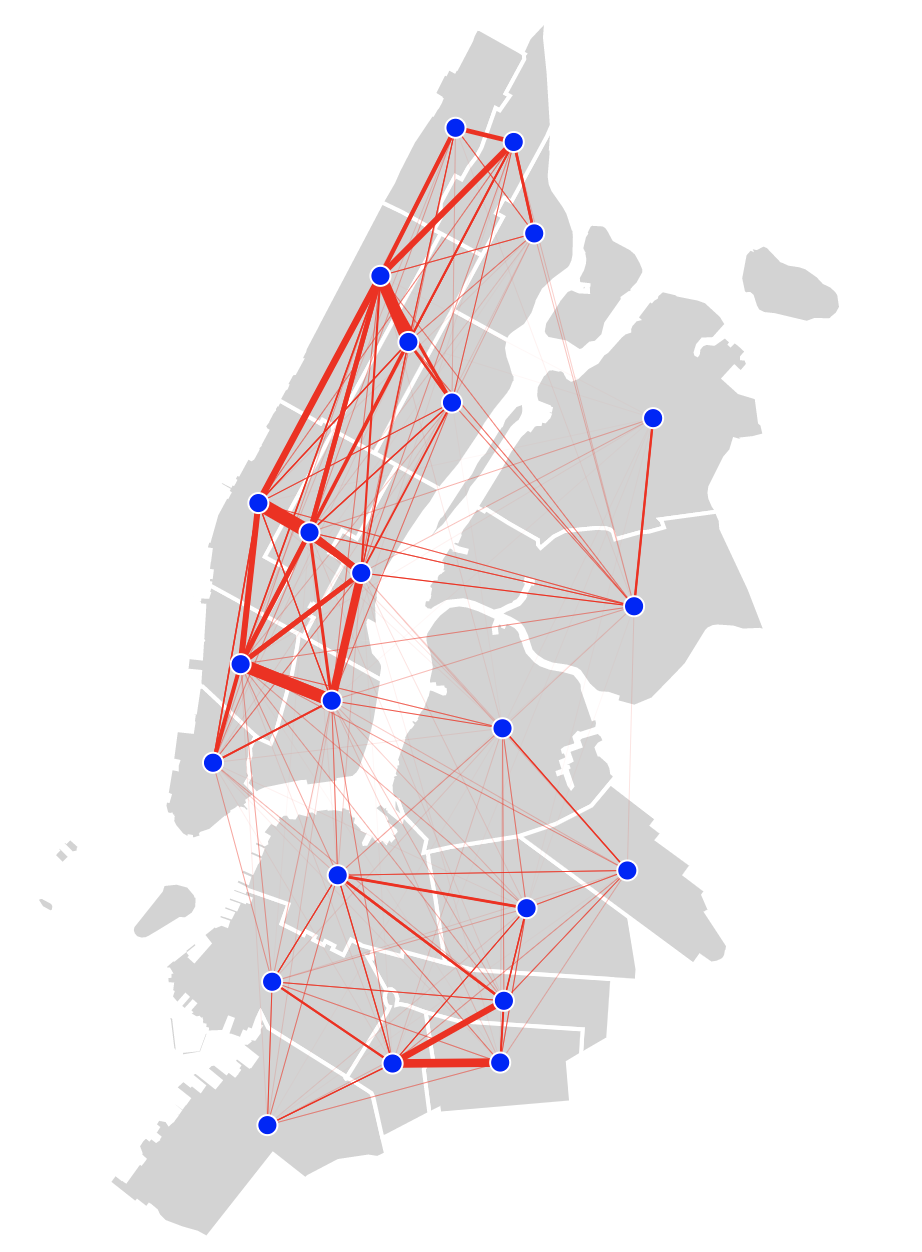
In this assignment, we will examine data from the Citi Bike System in New York City. Each bike rental is logged with its start station, end station, and trip duration. We wish to examine a subset of these trips to examine patterns between stations across the city, aggregating the individual trips into routes. We will use filtering and linked highlighting to help examine particular stations. We will examine trip duration and finally aggregate the trips by community districts.
Data
- NYC Citibike Trip Data (August 2019): https://gist.githubusercontent.com/dakoop/b1ddf4558e225c5155faeddba0fb3f12/raw/2f5aaa748ebbba3fb366e8970c08f7bbff17bbd6/citi-bike-nyc-2019-08-subset.json
- NYC Community District Boundaries GeoJSON: https://gist.githubusercontent.com/dakoop/b1ddf4558e225c5155faeddba0fb3f12/raw/2f5aaa748ebbba3fb366e8970c08f7bbff17bbd6/nyc-community-districts.json
The trip data is split into two parts, stations and trips. The stations data is an object where the keys are station ids and the values are information about the station including latitude, longitude, and the community district it is in. The trips data has information about an individual bike rental, including
start_station: the start station’s numeric idend_district: the end station’s numeric idtrip_duration: the average amount of time the trip tookstart_time: the start timestamp (as a unix timestamp)end_time: the end timestamp (as a unix timestamp)
0. Info
A template for the assignment is provided: html, js; save them both as source. You may use this or create your own files. It is highly recommended that you start from the provided template.
Update the template with the following information:
- Your name
- Your student id
- The course title (“Data Visualization (CSCI 627/490)”), and
- The assignment title (“Assignment 5”)
If you used any additional JavaScript libraries or code references, please append a note to this section indicating their usage to the text above (e.g. “I used the jQuery library to write callback functions.”) Include links to the projects used. You do not need to adhere to any particular style for this text, but I would suggest using headings to separate the sections of the assignment.
1. Linked Highlighting (30 pts)
In order to see the trips between the stations, we plot them as a node-link diagram where the line thickness indicates the number of trips along that route. In addition, we show the names of the stations in a list. Since it can be difficult to see which stations correspond to the points on the map, we will use linked highlighting to help link the station names and their locations on the map. A user that moves the mouse over a station name should see the corresponding station highlighted on the map. In addition, when the user moves the mouse over a station location, the name should be highlighted. Make sure to highlight both items, the name and point mark, when the mouse is over one or the other.
D3’s .on(<event>, <callback>) functions will help handle mouseover and mouseout events to instrument this functionality. See the linked highlighting example for some ideas on how this should work.
Hints
- When you get one direction working, the other direction will be similar.
- In a
mouseoverormouseoutevent handler, you can get the selected node asevent.currentTargetand can treat it as a D3 selection usingd3.select(event.currentTarget). - You can do selections inside the event handlers to select elements from the other views.
- Remember to remove highlights from districts other than the selected one.
- If you use a CSS rule for highlighting, look at D3’s
classedfunction for adding and removing a class.
2. Filtering (30 pts)
Even though we are able to see the stations and their names, there is a still a lot of visual clutter. We can use filtering to hide some of the stations. From a list of all the stations with checkboxes, a user should be able to uncheck a checkbox to hide the corresponding station and the trips to and from it on the map. Checking it again displays that station and trips. Here, the change event will capture changes to the checkboxes.
Hints
- I find it easier to use the CSS display rule for setting items to not show in an svg, but there are other methods as well (e.g. opacity)
3. Histogram (30 pts)
Now, we wish to understand the lengths of the trips in our subset. Create a histogram that shows this distribution. Determine a good bin size to help understand this distribution. Note that we have only included trips that are up to one hour (3600 seconds) long in the data subset.
Hints
- You should only need the trips data for this part of the assignment
d3.histogramis a function designed for creating histograms.- Use
.nice(number)on a domain to line up tick marks and boundaries.
4. [627 Only] Aggregation by District (30 pts)
Instead of filtering, create a new visualization that aggregates trips between different districts instead of stations. This requires a different aggregation of the data, and different map locations. The community districts in the GeoJSON file have a centroid property which has the longitude and latitude for the centroid of the district as a list. The new map will look similar except that it will have only one point mark per district and lines should only go between those districts. The line width should reflect the total number of trips between stations in the respective districts. This means that some links will be lost because they go between stations in the same district.
Hints
- This can be done with the same
createMapfunction provided in the template if you format the aggregated data in the same way as that data. d3.rollupallows you to aggregate data, and you can provide multiple keys to it (liked3.group).
Extra Credit
- CSCI 490 students may do Part 4 for extra credit
- Add a district listing with filters and linked highlighting for Part 4 (similar to Parts 1 & 2 but with district numbers).
- Add linked highlighting for the lines on the map to highlight both the start and end stations in the list.
- Add linked highlighting from the histogram to show those routes on the map that fall within the specified durations.